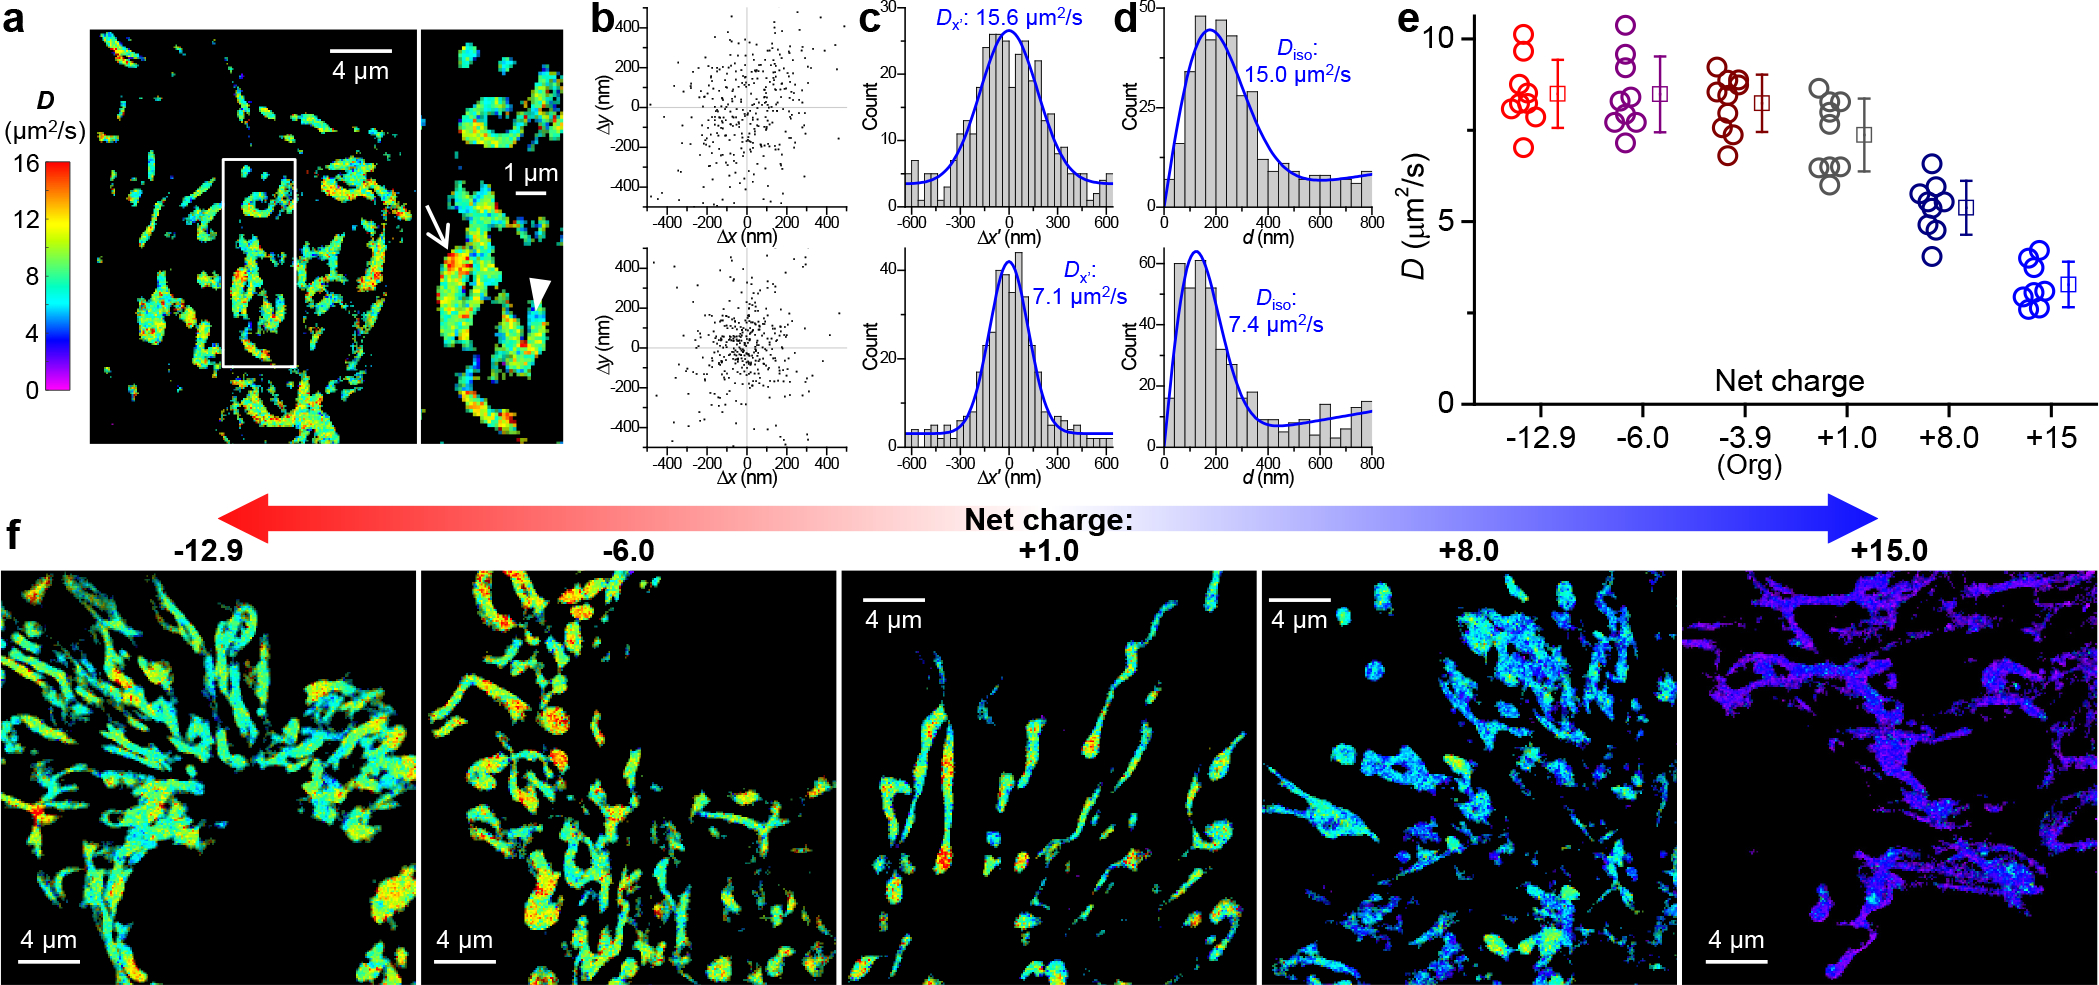
Figure 3.

SMdM quantification of diffusion in the mitochondrial matrix and effects of protein net charge. (a) Representative SMdM super-resolution D map of mito-Dendra2 in the mitochondrial matrix of a live COS-7 cell, alongside a zoom-in of the boxed region. (b) Two-dimensional plots of the vectorial 1-ms single-molecule displacements accumulated for the high-D (top) and low-D (bottom) regions indicated by the arrow and arrowhead in (a), respectively. The distributions show no strong directional preferences, with principal directions θ of 61° and 91° evaluated. (c) Distributions of the displacements in (b) after projecting along their respective θ directions. Blue curves: MLE fits to a one-dimensional diffusion model, yielding D = 15.6 and 7.1 μm2/s, respectively. (d) Distributions of the scalar magnitude of single-molecule displacements in (b). Blue curves: MLE fits to a two-dimensional isotropic diffusion model, yielding D = 15.0 and 7.4 μm2/s, respectively, comparable to that found in (c) with the one-dimensional diffusion model. (e) SMdM-determined D values for the different charge-varied versions of mito-Dendra2 diffusing in the mitochondrial matrix of live COS-7 cells. Circles: holistic D values of individual cells. Squares + bars: averages and standard deviations. (f) Representative SMdM super-resolution D maps of the differently charged mito-Dendra2 versions, on the same color scale as (a).
