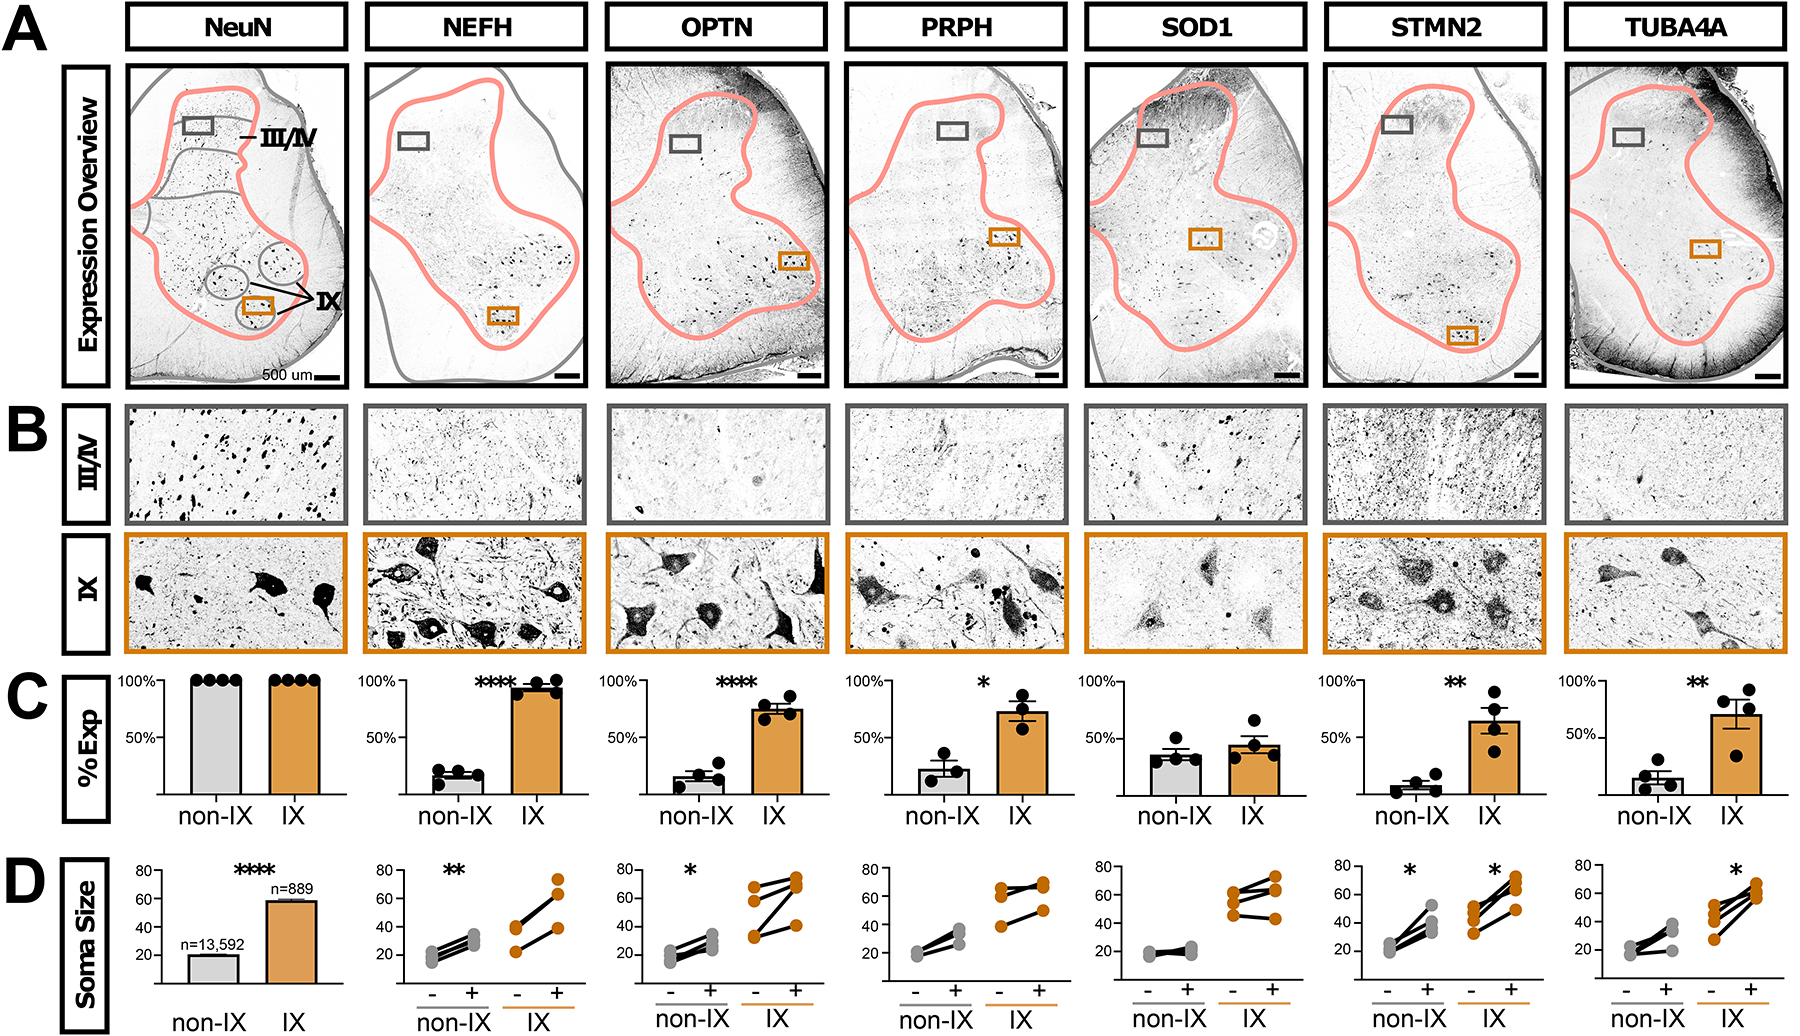
Fig. 7. ALS-related proteins are enriched in human motoneurons.

A, Antibody staining on adult human lumbar spinal cord against NeuN (RBFOX3 gene, general neural marker) and the ALS-related genes NEFH, OPTN, PRPH, SOD1, STMN2, and TUBA4A. Gray matter outlines are shown in pink and boundaries of lamina I/II, III/IV, V/VI, VII/VIII, IX, and X are shown in gray. Boxes indicate the enlarged images in panel. A, Images are representative of data from three subjects (two male and one female). Scale bars are 500 μm. B, Inset of the images in panel A, from the boxed region in laminae III/IV or lamina IX. The width of the insets is 500 μm. C, Quantification of the percent of NeuN+ neurons that co-expressed the indicated proteins in either all neurons not in lamina IX (non-IX) or those in lamina IX. The mean ± s.e.m. are shown. The plotted values and number of cells counted in each subject and category are available in Supplemental Table S7). Paired t-test results are shown where * indicates p < 0.05, ** indicates p < 0.005, **** indicates p < 0.0001. D, The sizes of NeuN+ neurons are shown for each indicated protein. For NeuN, 100% of cells were positive, by definition, and the total counts and sizes (mean ± s.e.m.) are shown for neurons not in lamina IX (non-IX) or those in lamina IX. For all other indicated proteins, the Feret distance sizes are shown for all neurons that did not (−) or did (+) express the indicated protein (mean Feret distance in μm). Each line joins values within one subject. There is an unpaired value for NEFH because we did not detect neurons in lamina IX that did not express NEFH. The plotted values and number of cells measured in each subject and category are available in Supplemental Table S7. Paired two-tailed t-test p-values, after Benjamini-Hochberg FDR correction, are shown where * indicates p < 0.05, ** indicates p < 0.005. **** indicates p < 0.0001. See also Supplemental Figures S24 and S25.
