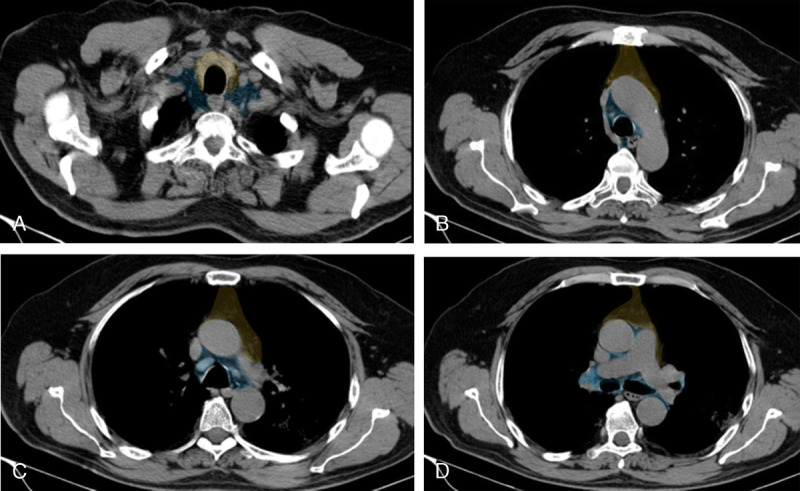
FIGURE 6.

A, (Color overlay) Lymph node map. Axial noncontrast coned-down thorax CT with mediastinal window settings images at the level of thoracic inlet shows the anterior (perithymic) region (yellow) and deep (thoracic and cervical) region (blue). Images can be viewed in color online at www.jcat.org. B, (Color overlay) Lymph node map. Axial noncontrast coned-down thorax CT with mediastinal window settings images at the level of aortic arch shows the anterior (perithymic) region (yellow) and deep (thoracic and cervical) region (blue). Images can be viewed in color online at www.jcat.org. C, (Color overlay) Lymph node map. Axial noncontrast coned-down thorax CT with mediastinal window settings images at the level of aorta pulmonary window shows the anterior (perithymic) region (yellow) and deep (thoracic and cervical) region (blue). Images can be viewed in color online at www.jcat.org. D, (Color overlay) Lymph node map. Axial noncontrast coned-down thorax CT with mediastinal window settings images at the level of pulmonary arteries shows the anterior (perithymic) region (yellow) and deep (thoracic and cervical) region (blue). Figure 6 can be viewed online in color at www.jcat.org.
