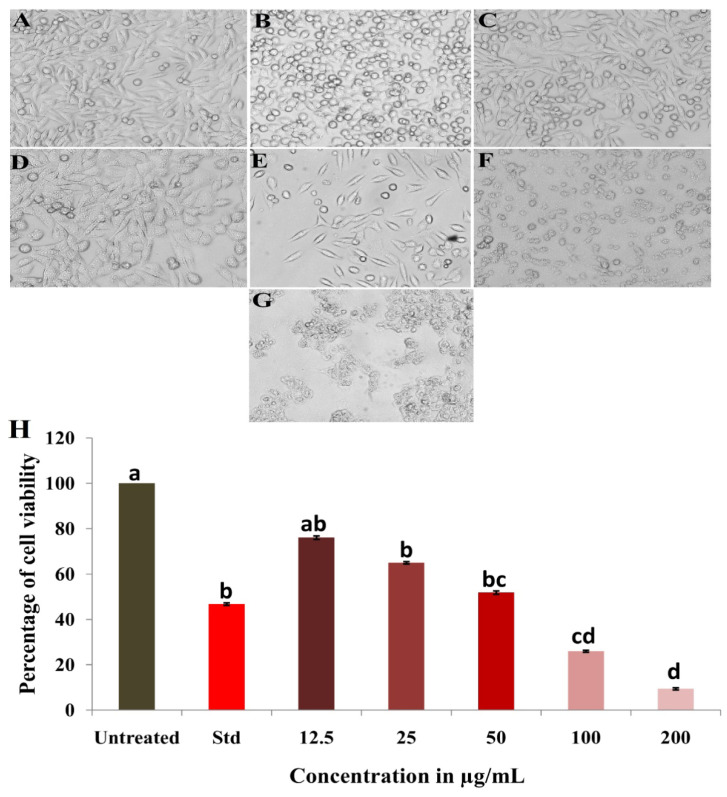
Figure 10.
Morphological changes in the MDA-MB-231 cell line after exposure to different concentrations of AgNPs synthesized from Penicillium brasilianum NP5; (A) Untreated, (B) Standard, (C) 12.5 μg/mL, (D) 25 μg/mL, (E) 50 μg/mL, (F) 100 μg/mL, (G) 200 μg/mL of NP5-AgNPs, (H) Graph showing the percentage of cell viability on MDA-MB-231 cancer cells at different concentrations of NP5-AgNPs. Data are statistically significant at p ≤ 0.01 by one-way ANOVA with Tukey’s B test, error bars are based on three independent experiments (means ± SD, n = 3). Different letters at the concentrations refer to the data that are significantly different.

