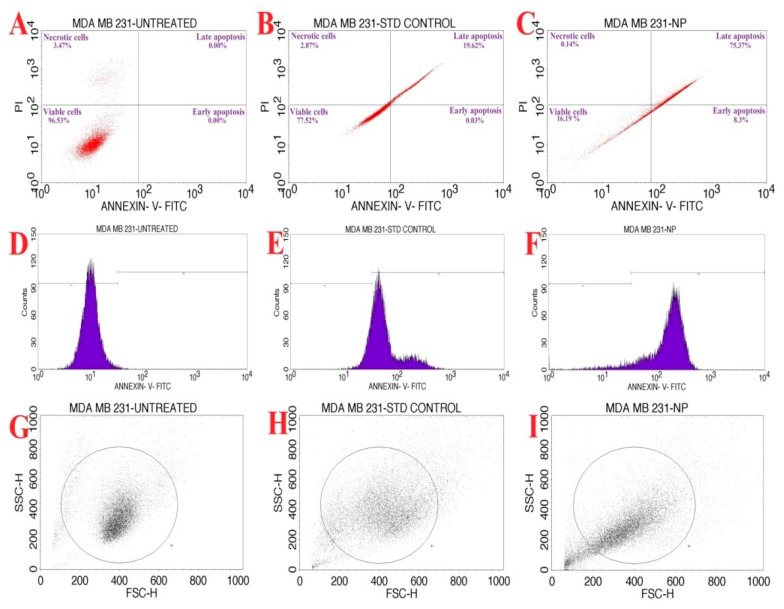
Figure 12.
Flow cytometric analysis of synthesized AgNPs from Penicillium brasilianum NP5 against the MDA-MB-231 cancer cell line. Quadrangular plot of Annexin V/PI expression on MDA-MB-231 cells; (A) Untreated, (B) Standard, (C) NP5-AgNPs treated cells. Cells count on Annexin-V/FITC; (D) Untreated, (E) Standard, (F) NP5-AgNPs treated cells. Scatter plot of forward scatter (FSC) against side scatter (SSC); (G) Untreated, (H) Standard, (I) NP5-AgNPs treated cells.

