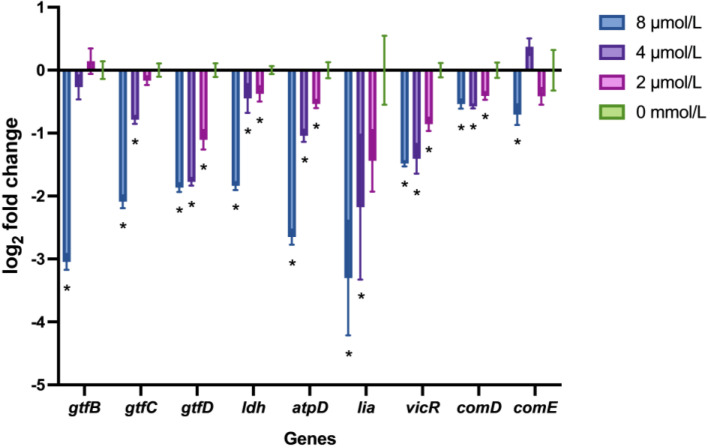
Figure 4.
The expression profiles of the Streptococcus mutans virulence-associated genes under LF-1 treatment were evaluated by real-time quantitative PCR. The gene expressions are presented as log2 fold change (mean ± standard deviation) normalised to 16S rDNA gene transcription from at least three independent experiments. Asterisks (*) indicate a significant statistical difference from the untreated control (two-way analysis of variance; p < 0.05).

