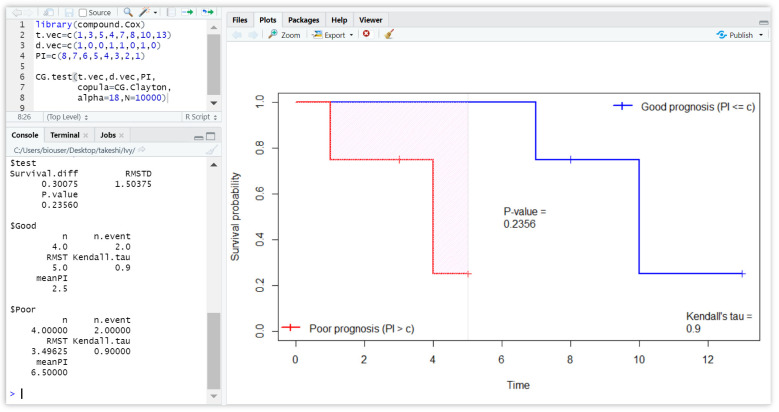
Figure 3.
The R console showing the test results for the difference for the good and poor prognoses. The right panel gives the plots of the Clayton CG estimates computed by data 1, 3, 5, 4, 7, 8, 10, 13; 1, 0, 0, 1, 0, 1, 0; 8, 7, 6, 5, 4, 3, 2, 1. The Clayton copula’s parameter is specified as . More detailed results, such as the difference () and the RMSTD (), are given in the left panel.

