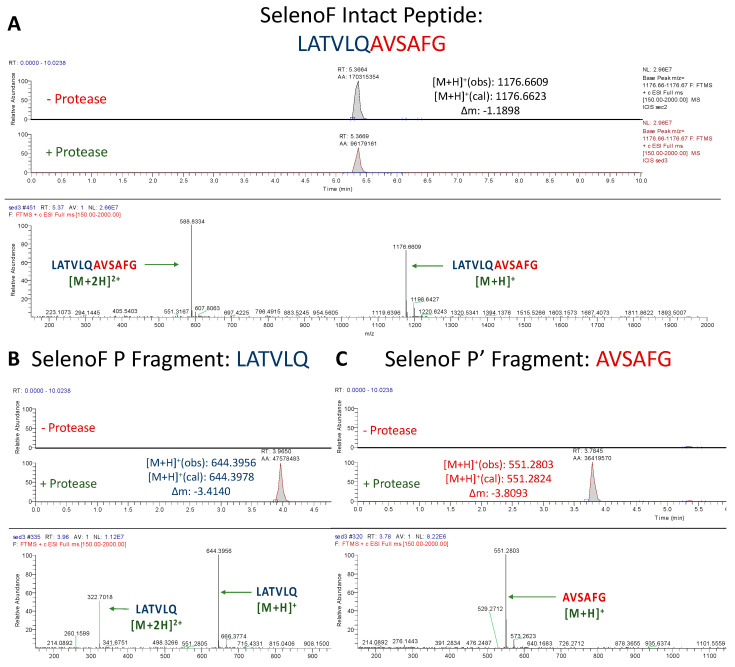
Figure 6.
UPLC-MS Data for SelenoF Peptide. Depicted are the extracted ion chromatograms for the samples without protease and with protease (top) and the mass spectra (bottom) for (A) the Intact Peptide, (B) the P Fragment, and (C) the P′ Fragment. The base peaks for the P and P′ Fragments had normalization levels of 2.96 × 10⁷ and 1.12 × 10⁷, respectively. High resolution mass spectrometric analysis corroborates the identities of each base peak in the corresponding extracted ion chromatogram.

