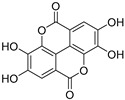
Table 3.
Bioavailability in human of some natural polyphenols (Adapted from [95]).
| Polyphenol | Structure | Food | Concentration in Food | Concentration in Plasma |
|---|---|---|---|---|
| Anthocyanin |

|
Blackberries | 960 µM 200 g−1 | NA |
| Naringenin |

|
Oranges | 7.9 mg 100 g−1 FW | Mean Cmax 80 nM, Tmax 5.88 h |
| Hesperetin |

|
Oranges | 53.1 mg 100 g−1 FW | Mean Cmax 90 nM, Tmax 7 h |
| Quercetin |

|
Dry shallot skin | 4.9 µmol g−1 FW | Mean Cmax 3.95 µM, Tmax 2.78 h |
| Daidzein |

|
Soy milk | 2.2 mg 100 mL−1 | 196.1 nM after 5 days |
| Genistein |

|
Soy milk | 6.8 mg 100 mL−1 | 797.04 nM after 5 days |
| Ellagic acid |

|
Blackberries Raspberries | 300 µg g−1 DW | Mean Cmax 10 nM, Tmax 1.98 h |
| Gallic acid |

|
Grape skin | 700 µg g−1 DW | NA |
FW: fresh weight. DW: dry weight. NA: not available.
