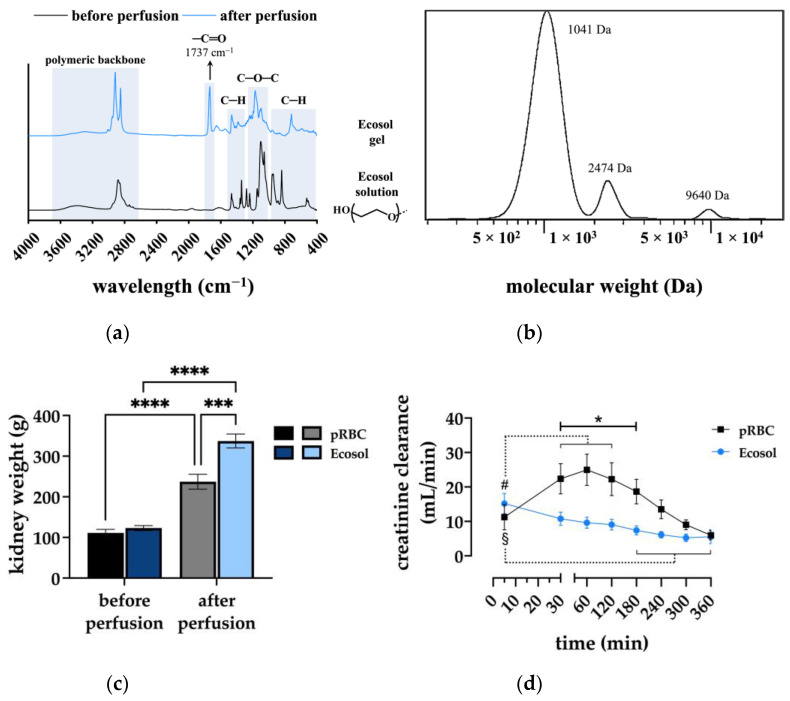
Figure 6.
(a) FTIR spectra of the Ecosol solution before and after perfusion; (b) GPC analysis of the Ecosol solution demonstrating the Mw of PEG; (c) kidney weights of both experimental groups before and after 6 h NMP; *** p < 0.001; **** p < 0.0001; and (d) creatinine clearances of both groups during 6 h NMP; * p < 0.05 (pRBC vs. Ecosol); # p < 0.05 (pRBC time point vs. pRBC baseline); § p < 0.05 (Ecosol time point vs. Ecosol baseline).

