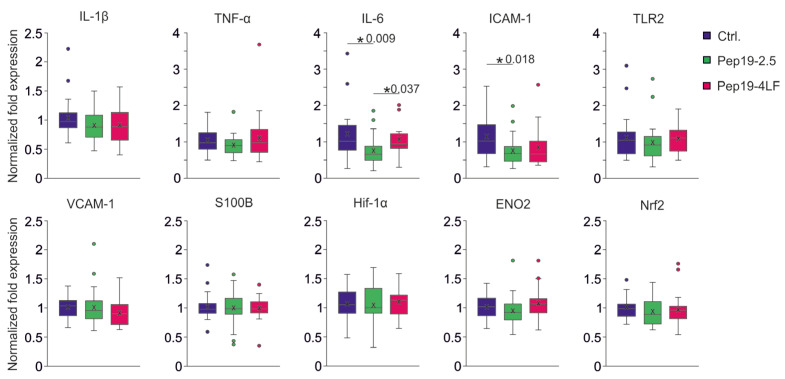
Figure 6.
mRNA Expression levels of brain tissue from 4 h after CA-CPR. All results were presented as boxplots showing the quartiles, the 5th and 95th percentiles (whiskers), the median (line) and the mean (x). Normalized expression of each group (n = 6) of cytokines (TNF-α, IL-6, IL1β), cell adhesion molecules (ICAM-1, VCAM-1), TLR2, transcription factors (HIF-1α; Nrf2), neuron-specific marker (S100B, ENO2 (NSE)). All expression differences were Kruskal-Wallis tested. IL-6 mRNA expression level was lower in the Pep19-2.5 compared to the control (p = 0.009) as well as the Pep19-4LF group (p = 0.037). The level of ICAM-1 mRNA expression was lower in the Pep19-2.5 than in the control group (p = 0.018).

