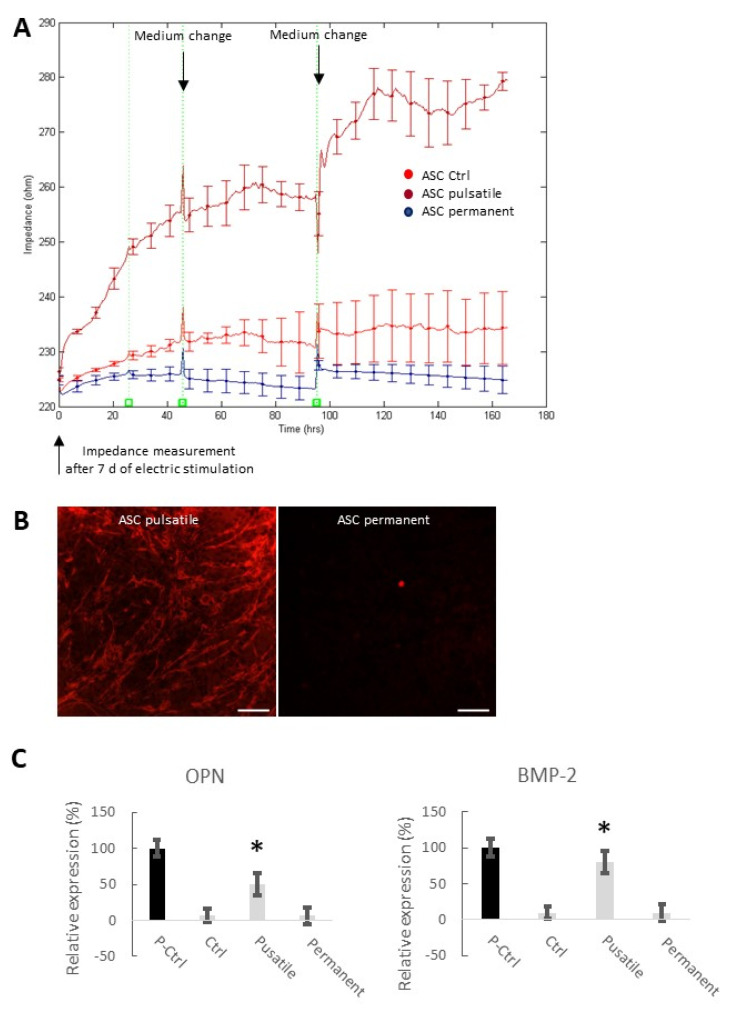
Figure 4.
Impedance measurements at 16 kHz after seven days of electrical stimulation. (A) Impedance was measured in non-stimulated, pulsatile, and continuous electrically stimulated ASCs. At t = 0 h, cells were seeded on the chips. Medium changes occurred every two days (mean ± SD, n = 3–5). (B) Alizarin Red staining of the calcium deposits in pulsatile and continuous electrically stimulated ASCs after 21 days. Note that medium changes caused short-term impedance alterations due to the small temperature fluctuations. Scale bar: 100 µm. (C) Expression analysis of two relevant osteogenic marker genes (i) osteopontin (OPN), also known as bone sialoprotein I, and (ii) bone morphogenetic protein 2 (BMP-2). Notably, transcript levels of the two marker genes of the positive control (P-Ctrl; chemically differentiated ASCs) and the electrically, pulsatile stimulated ASCs for seven days are significantly higher in comparison to the negative control (Ctrl) and the permanently stimulated stem cells (mean ± SD, n = 3; * p < 0.05 considered significantly different compared to the negative control (Ctrl)).

