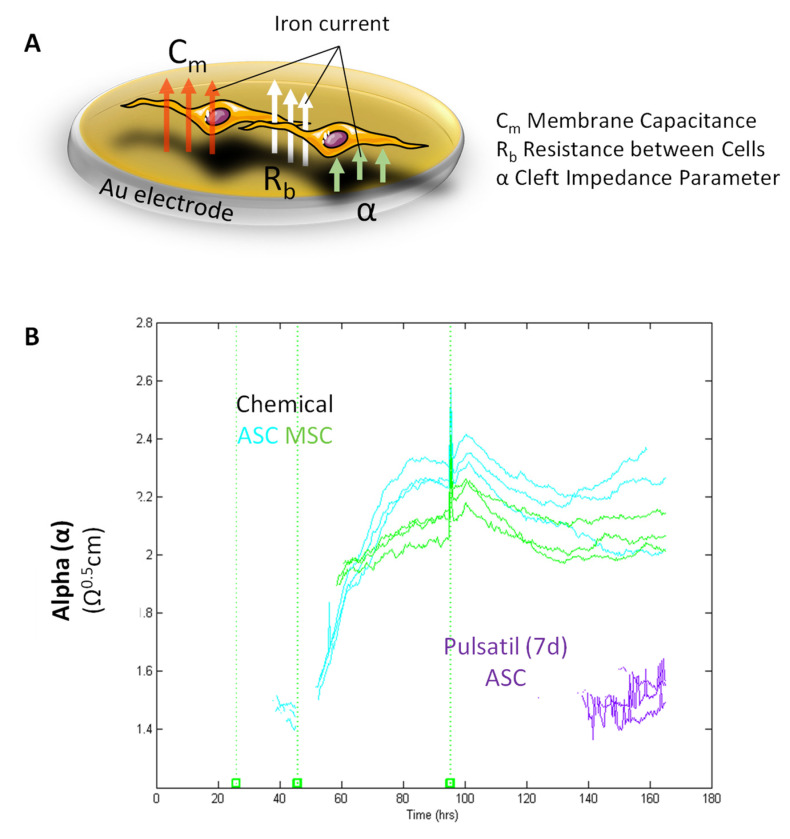
Figure 5.
Impedance Modeling. (A) Schematic illustration presenting the modeled parameters Rb, α, and Cm. Rb describes the paracellular barrier between cells caused by tight cell-to-cell junctions; α models the basal adhesion, indicating the cell-to-substrate interaction; Cm shows the cell membrane capacitance. Notably, α is dependent on the cell radius and the subcellular adhesion. Adapted by Giaver and Keese [4]. Created with www.biorender.com. (B) Calculation of the cell-to-substrate interactions (α) in chemical osteogenic and electrically stimulated stem cells from the adipose origin (ASC) and bone marrow (BMSC). The equation for calculating α is given in the right corner: rc = cell radius, p = specific electrolyte resistivity in the cleft, and h = distance between membrane and electrode. Notably, the higher the distance (h) from cells to substrate, the smaller α. Chemical osteogenic stimulated ASCs and BMSCs revealed a continuous increase in α over time. Pulsatile electrical stimulation of ACSs also showed a rise in α starting at 140 h. During seven days, no alterations in α were observed for POBs, control-treated, and electrically continuously stimulated stem cells (n = 3–5).

