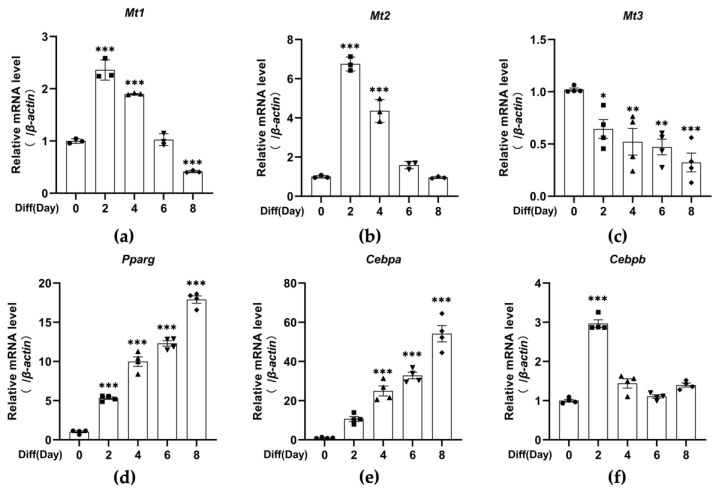
Figure 1.
The mRNA levels of Mt3 are significantly decreased during 3T3-L1 adipocyte differentiation. The differentiation of 3T3-L1 adipocytes was induced by the differentiation cocktail. (a–f) RT-qPCR analysis was used to detect the mRNA levels of Mt1, Mt2, Mt3, Pparg, Cebpa, and Cebpb at specific times (days 0, 2, 4, 6, and 8). β-actin served as a loading control. The data are presented as the means ± SEM. * p < 0.05, ** p < 0.01, *** p < 0.001 vs. the corresponding control group (day 0) were calculated by one-way ANOVA followed by Dunnett’s Test.

