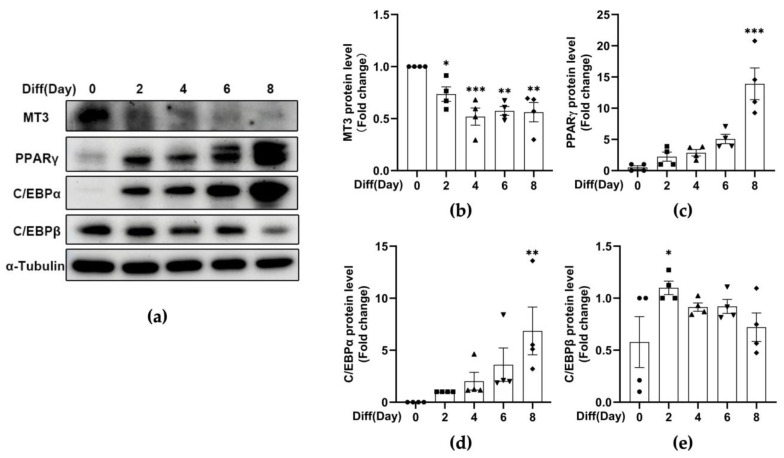
Figure 2.
The protein levels of MT3 are significantly decreased during 3T3-L1 adipocyte differentiation. The differentiation of 3T3-L1 adipocytes was induced by the differentiation cocktail. (a) Immunoblotting was used to detect the protein levels of MT3, C/EBPα, C/EBPβ, PPARγ, and α-Tubulin at specified times (days 0, 2, 4, 6, and 8). α-Tubulin was used as a loading control. (b–e) The intensities of bands (MT3, C/EBPα, C/EBPβ, and PPARγ) were quantified and normalized with the corresponding α-Tubulin bands. The data are presented as the means ± SEM. * p < 0.05, ** p < 0.01, *** p < 0.001 vs. the corresponding control group (day 0) were calculated by one-way ANOVA followed by Dunnett’s Test.

