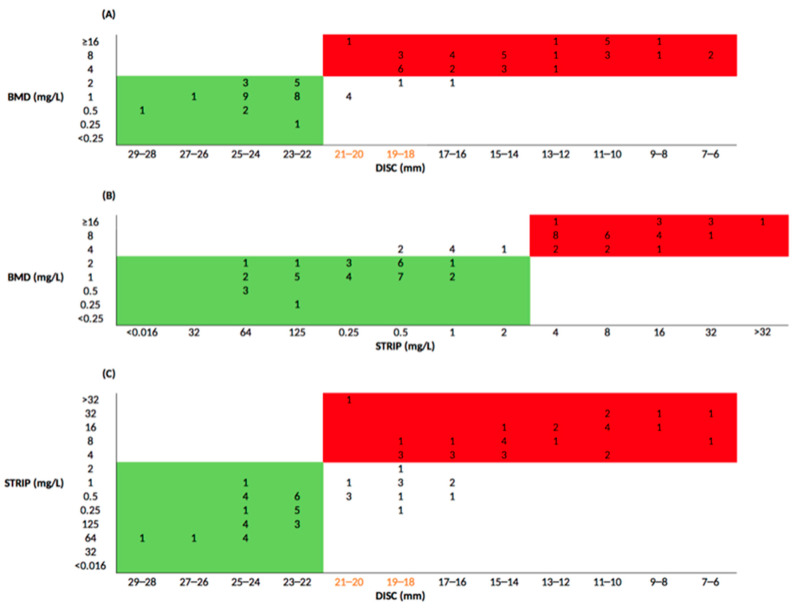
Figure 2.
Comparison between AST methods applying EUCAST clinical breakpoints. Green and red boxes highlight the number of KPC-Kp strains sensitive and resistant to both methods, respectively; yellownumbers indicate strains within the ATU zone. (A) Comparison between BMD and DD MIC values; (B) Comparison between BMD and strip test MIC values; (C) Comparison between strip test and DD MIC values.

