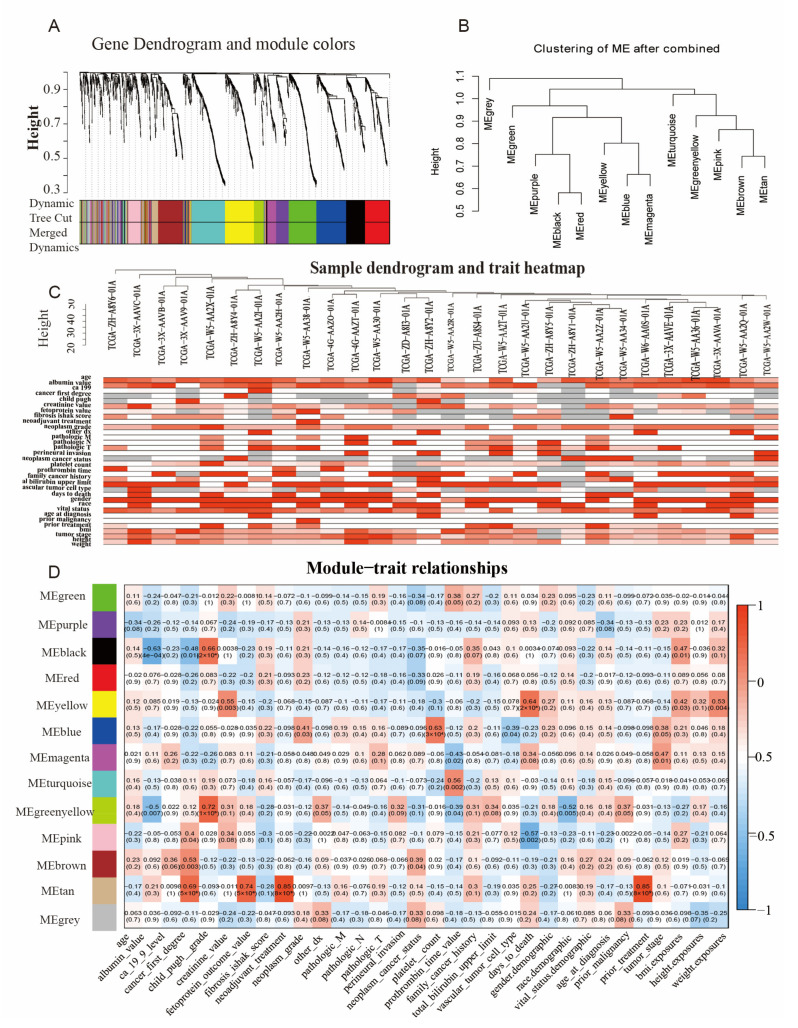
Figure 4.
Construction of WGCNA network. (A) Dendrogram of gene topological matrix branch (MEs with similarity > 0.75 were merged). (B) Dendrogram and heatmap of 13 eigengenes. Dynamic tree of the merged MEs with similarity greater than 0.75. (C) Clinical modules were clustered, and correlations were investigated with a sample dendrogram. The color of the heat indicated the correlation value. With respect to clinical data, red represents a high value, white means a low value, and gray means a missing value. (D) Heatmap of correlations between MEs and clinical features of CCA. The correlation coefficient (cor) and corresponding p-value (p-value) between different gene modules and clinical traits. According to the size of correlation coefficient (cor), the darker red represents positive correlation, and the darker blue represents negative correlation.

