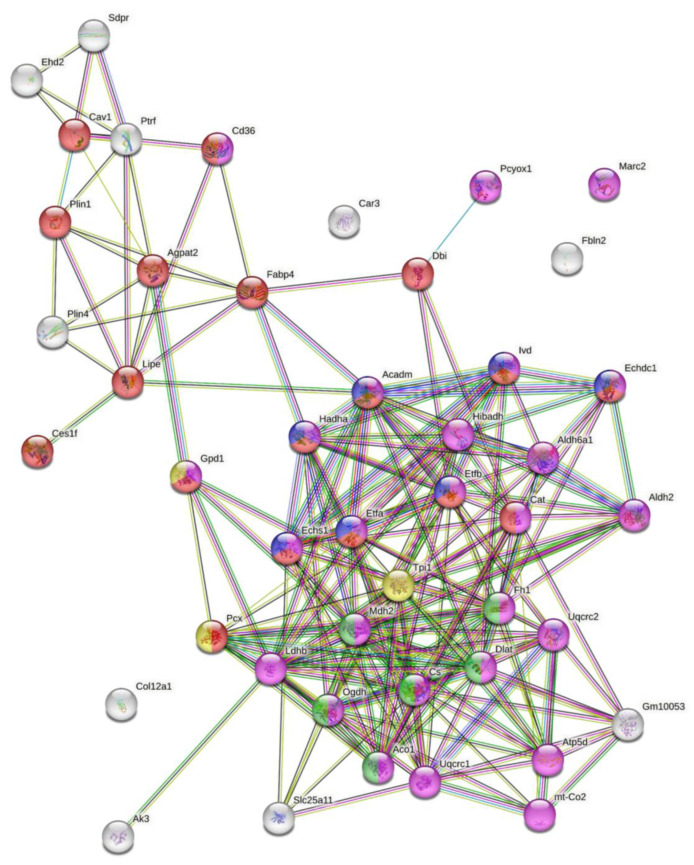
Figure 6.
GO analysis of proteins modulated by Pcyox1 silencing. Enriched GO terms in the biological process category are highlighted in different colors: red, lipid metabolic processes; violet, oxidation-reduction processes; blue, fatty acid β-oxidation; green, tricarboxylic acid cycle; yellow, gluconeogenesis.

