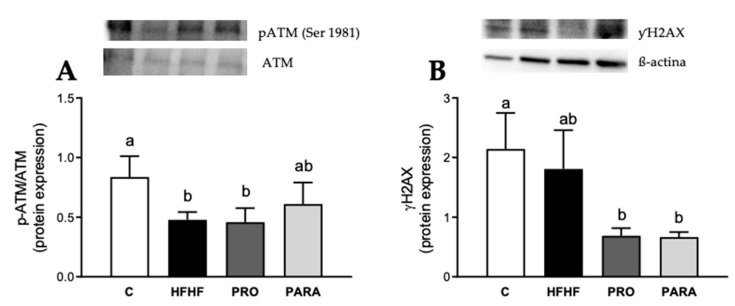
Figure 3.
Activation rate (phosphorylation) of ATM (A) and protein expression levels of γH2AX (B) in liver samples of rats fed a control diet (C), a high-fat high-fructose diet (HFHF) or a high-fat high-fructose diet supplemented with viable or heat-inactivated 109 CFU/day of Lactobacillus rhamnosus GG (PRO and PARA, respectively). Values are presented as mean ± SEM. Differences among the groups were determined by using one-way ANOVA, followed by the Newman–Keuls post hoc test. Bars not sharing common letters are significantly different (p < 0.05). ATM: ataxia-telangiectasia mutated, γH2AX: phosphorylated histone H2AX.

