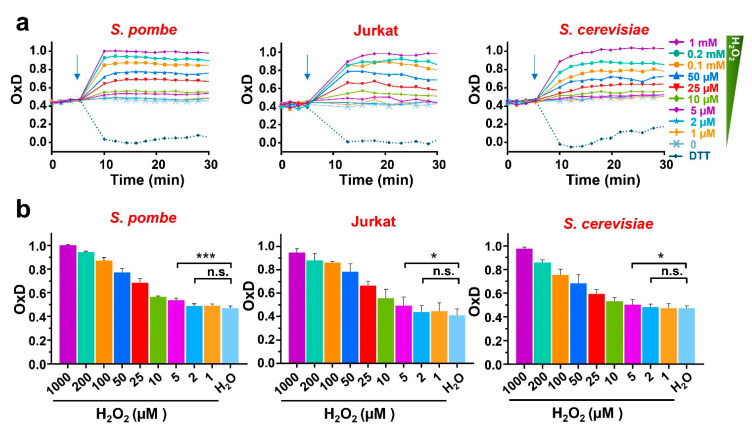
Figure 2.
H2O2-dependent oxidation of roGFP2-Tpx1.C169S expressed in S. pombe, Jurkat T cells, and S. cerevisiae. Wild-type of S. pombe (HM123), S. cerevisiae (BY4741), or Jurkat T cells, transformed with p407.C169S, p791, or p797 to express roGFP2-Tpx1.C169S, were grown in their own media (MM-, SD-, or RPMI 1640-supplemented), centrifuged and resuspended in MM (both yeasts) or ISO (Jurkat) for a final OD600 of 1 (both yeasts) or 0.5 (Jurkat cells). Then, 190 µL of these cell suspensions were plated in 96-well imaging plates, and incubation and fluorescence recording were initiated at 37 °C with 100 rpm shaking. After 4 cycles, the indicated treatments of DTT or H2O2 were applied (indicated with arrows). The degree of probe oxidation, or OxD (amount of probe oxidation per 1), is indicated over time. (b) Bar graphs represent the average of 3 OxD values from the 12 to 17 min time points for each treatment and cell type represented in (a). Statistical significance was calculated between the indicated samples with a ratio paired Student’s t-test with p-values of 0.05 (*) and 0.001 (***); n.s., non-significant. For each strain, average data from four biological replicates are shown, with error bars (S.D.) of (a) displayed in Figure S1.

