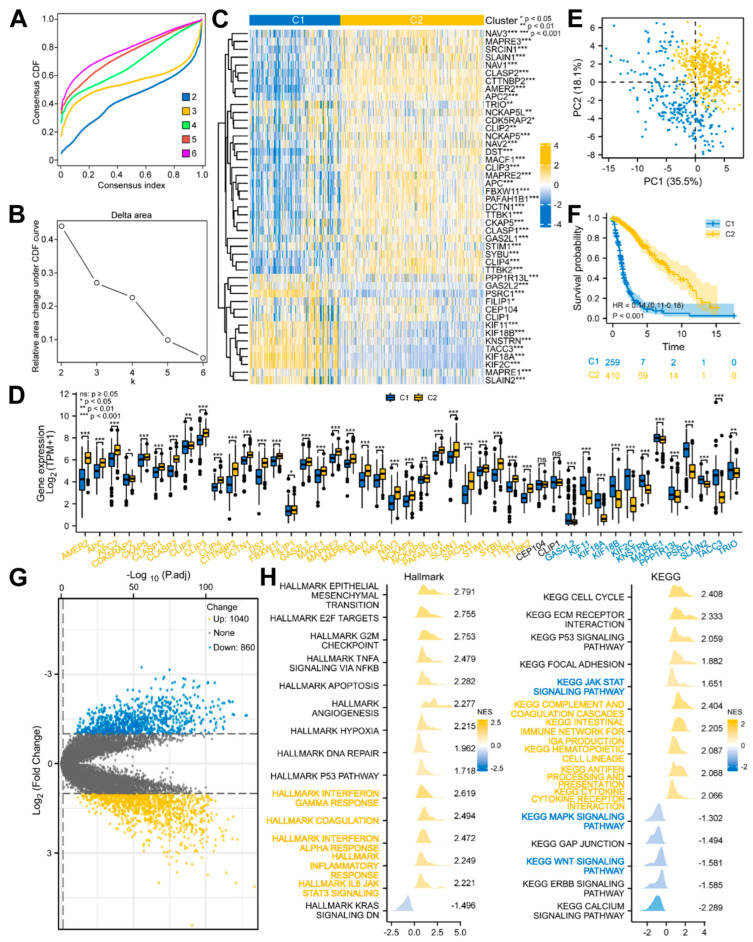
Figure 4.
Glioma patients with DEMPERGs were distinguished into two subgroups via unsupervised consensus clustering with differences in survival and function. (A) Consensus CDF curve of two to six clusters. (B) Relative area changes under the CDF curve from k = 2 to 6. (C) Complex heatmap of the DEMPERG expression in two clusters. (D) DEMPERG expression between the two clusters. (E) PCA plot. (F) KM OS plot. (G) Volcano plot of the cluster-associated genes. (H) Ridge plots of the GSEA. Yellow and blue words represent immune− and cancer−stemness−associated pathways, respectively.

