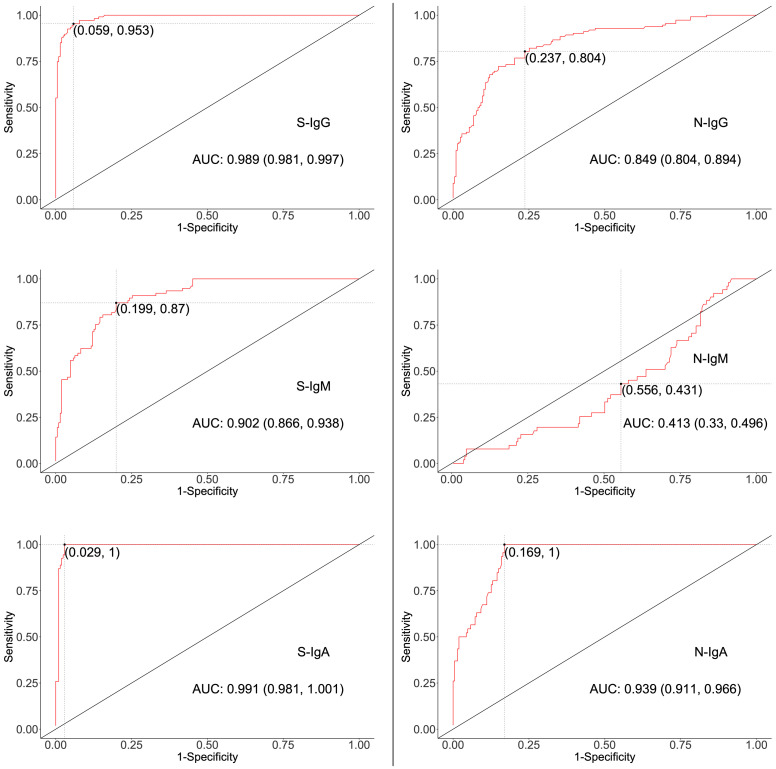
Figure 1.
ROC curves for determining Cut-offs for spike- and nucleoprotein-directed antibodies. The two-dimensional algorithm ROC graph visualizes how well the test classifies subjects as positives or negatives for S- or N-directed IgG, IgM, or IgA antibodies. AUC; Area under the Curve, with 95% Confidence interval.

