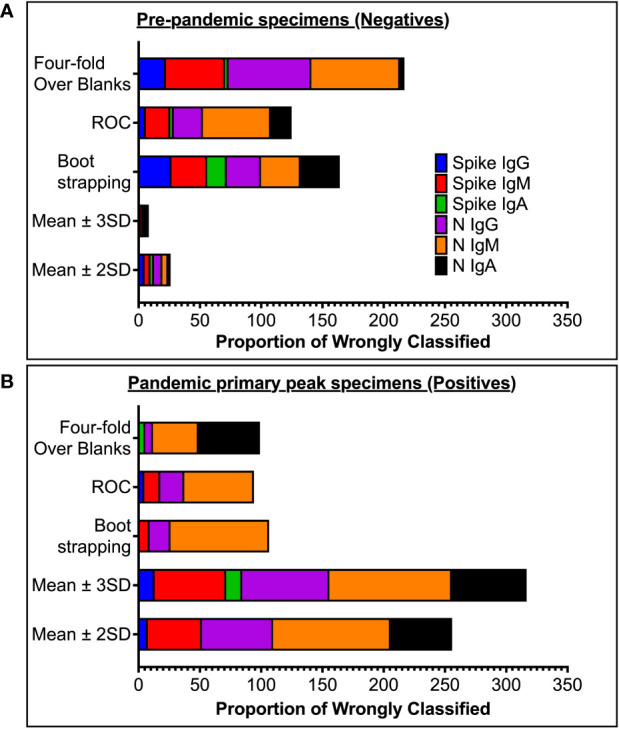
Figure 3.

Proportion of wrongly classified specimen serostatus. (A) shows proportions of pre-pandemic (negative) specimens wrongly classified as positive (false positives). (B) shows proportions of antibody-peak specimens from PCR-confirmed subjects (positives) wrongly grouped as negative (false negative) using the five different methods of computing cut-off values.
