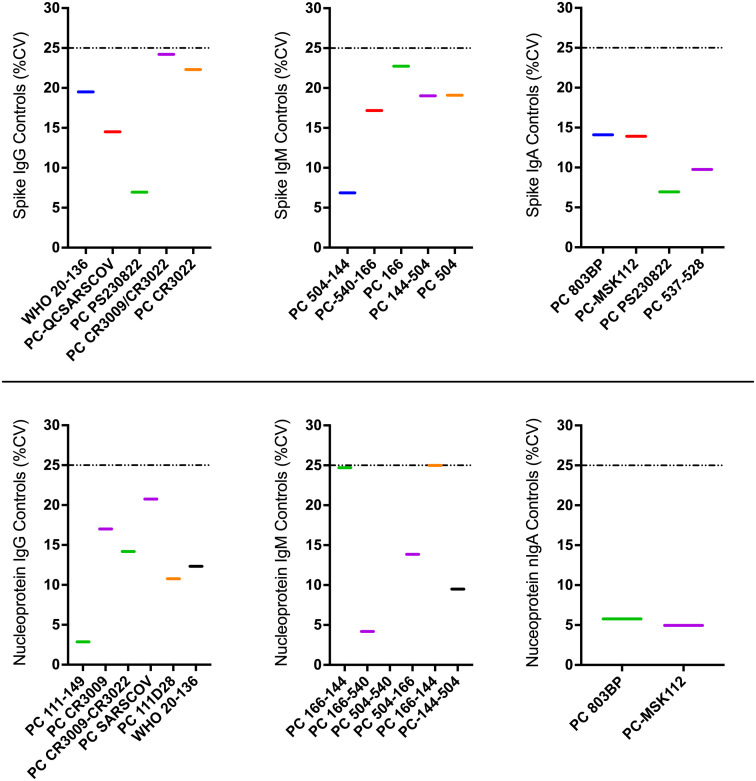
Figure 5.
Illustrates inter-operator proficiency comparisons obtained by different operators testing identical control specimens repeatedly as part of the in-house ELISA. Colored horizontal bars represent the %CVs of concentrations for each quantified antibody-antigen specificity. The dotted horizontal lines represent the 25% CV proficiency cut-off.

