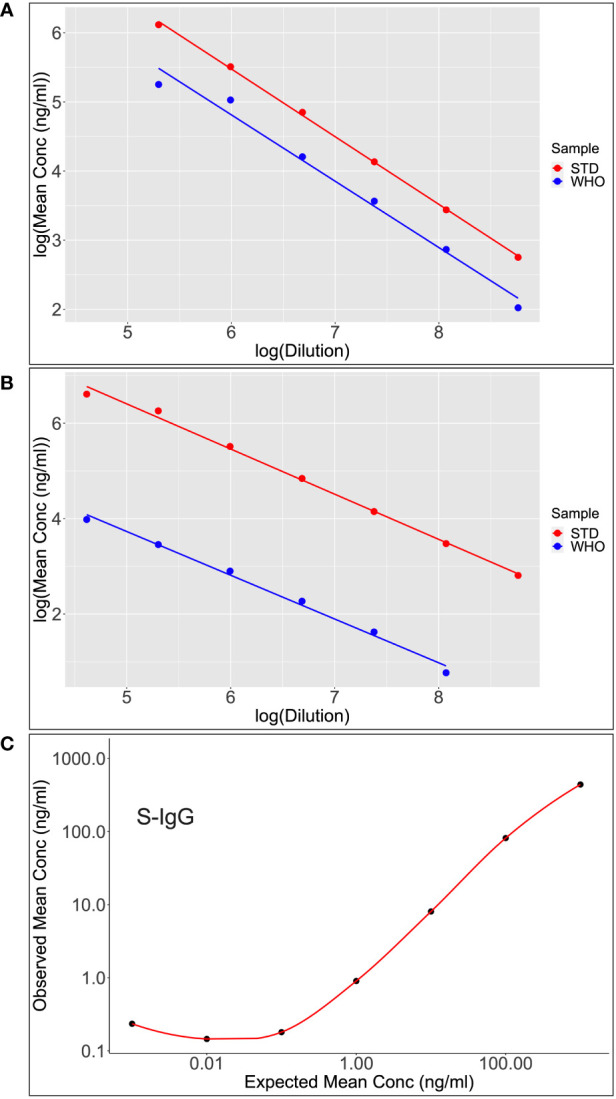
Figure 6.

Shows scatter plots and lines of best fit for S-IgG (A) and S-IgA (B) following calibration of the WHO standard (WHO) against the assay commercial standard (STD). After analyzing the parallelism and linearity of the WHO and secondary standards linear models, a linear regression analysis was fitted to convert concentration in ng/ml to BAU/ml. Dilutional linearity was computed using a linear regression model to show the ability of the assay to provide results (Concentration(ng/ml) that are directly proportional to the expected Concentrations (ng/ml) at the various dilutions (C).
