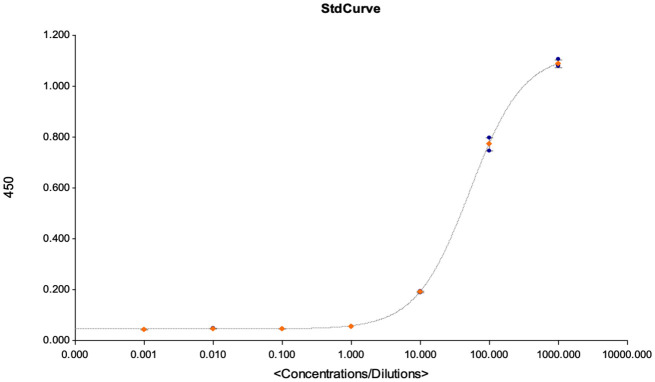
Figure 7.
This figures shows the goodness of fit curves that were used as a criterion for accepting the assay for quantification of the detected antibodies. The graph is an illustration of a standard curve used for extrapolating antibody concentrations from OD450 values, and to calculate the assays LOD, LOQ and LOB at linearity R2 > 0.9.

