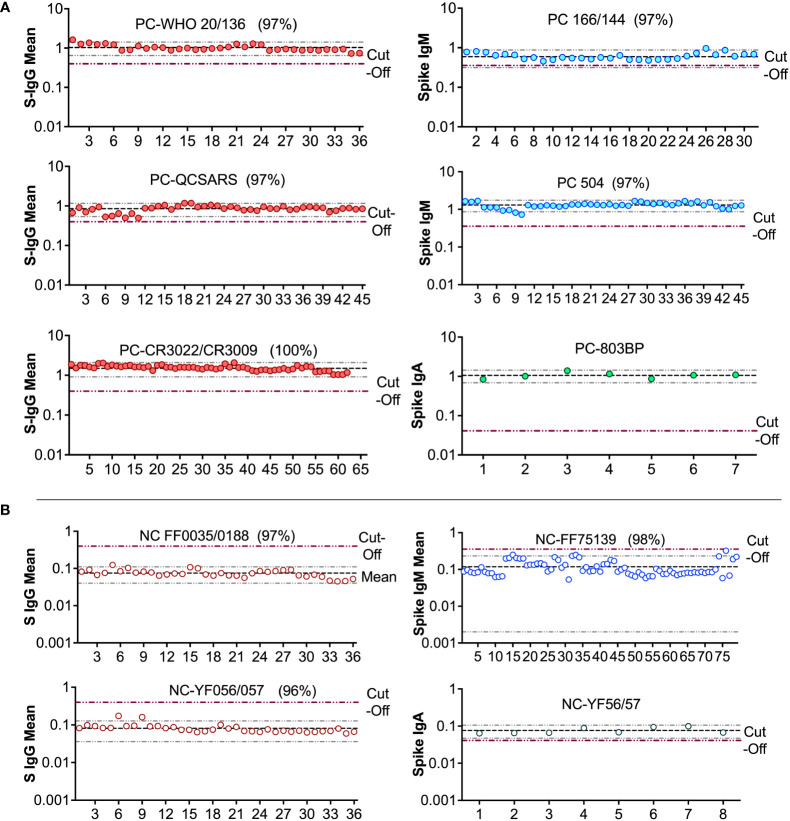
Figure 8.
Levy Jennings charts plotted from a WHO international standard panel (20/136) and in-house local controls (A): Levy-Jennings charts to track consistency of the in-house and international positive controls. (B) shows Levy-Jennings charts demonstrating the range of standard deviations from mean OD450 over time, with repeated use of local and WHO standard negative controls.

