Figure 4.

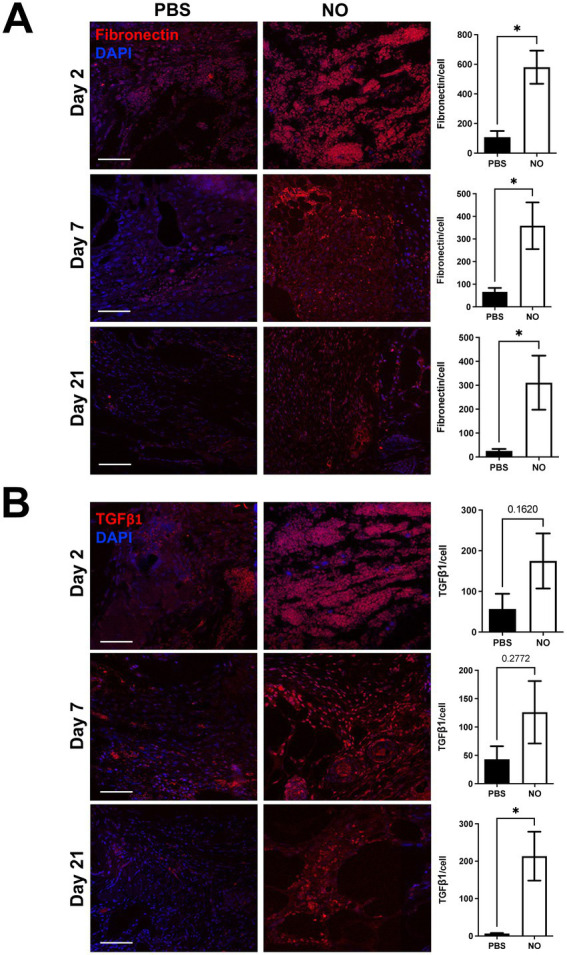
(A) Immunostaining for Fibronectin and (B) TGF-β1 in tissue sections on days 2, 7, and 21 (healed). Scale bars: 50 μm. Quantification of percent area positive for marker in each section. Data are presented as mean value ± SEM, *p < 0.05.

(A) Immunostaining for Fibronectin and (B) TGF-β1 in tissue sections on days 2, 7, and 21 (healed). Scale bars: 50 μm. Quantification of percent area positive for marker in each section. Data are presented as mean value ± SEM, *p < 0.05.