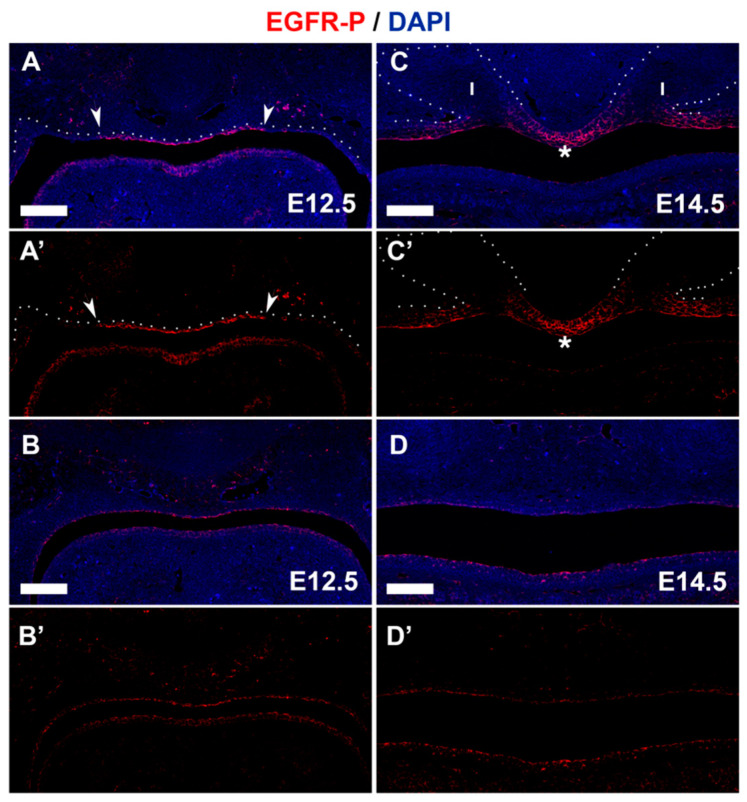
Figure 8.
EGFR is expressed at high levels in the forming midline. Murine frontal sections. (A–B’) E12.5. (C–D’) E14.5. (A–D) Immunofluorescence EGFR (pink/red) plus DAPI (blue). (A’,B’,C’,D’) EGFR only. (A,A’,C,C’) Anterior region. (B,B’,D,D’) More posterior region. Arrows in (A,A’) highlight border of expression of EGFR in the midline at E12.5. Asterix in (C,C’) highlights midline between cap stage incisors (outlined with white dots). I = incisor. Scale bar in (A,C): 100 μm (same scale in all images).

