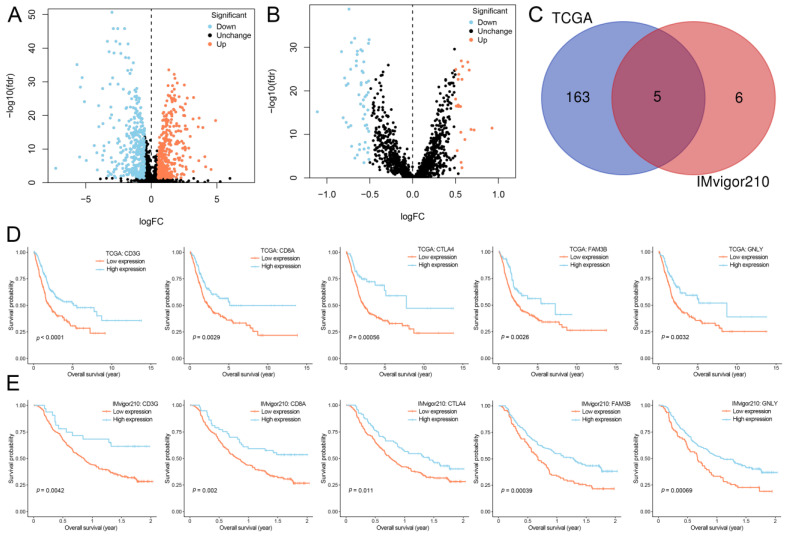
Figure 3.
Selection of OS-associated IRGs. (A) Volcano plot of 739 IRGs differentially expressed between luminal and basal subtypes in TCGA. (B) Volcano plot of 75 IRGs differentially expressed between luminal and basal subtypes in IMvigor210. (C) Venn diagram of the five common OS-associated IRGs between TCGA and IMvigor210. (D) Kaplan–Meier curves of OS for patients based on five selected IRGs in TCGA. (E) Kaplan–Meier curves of OS for patients based on five selected IRGs in IMvigor210. OS, overall survival; IRGs, immune-related genes; TCGA, The Cancer Genome Atlas; FC, fold change.

