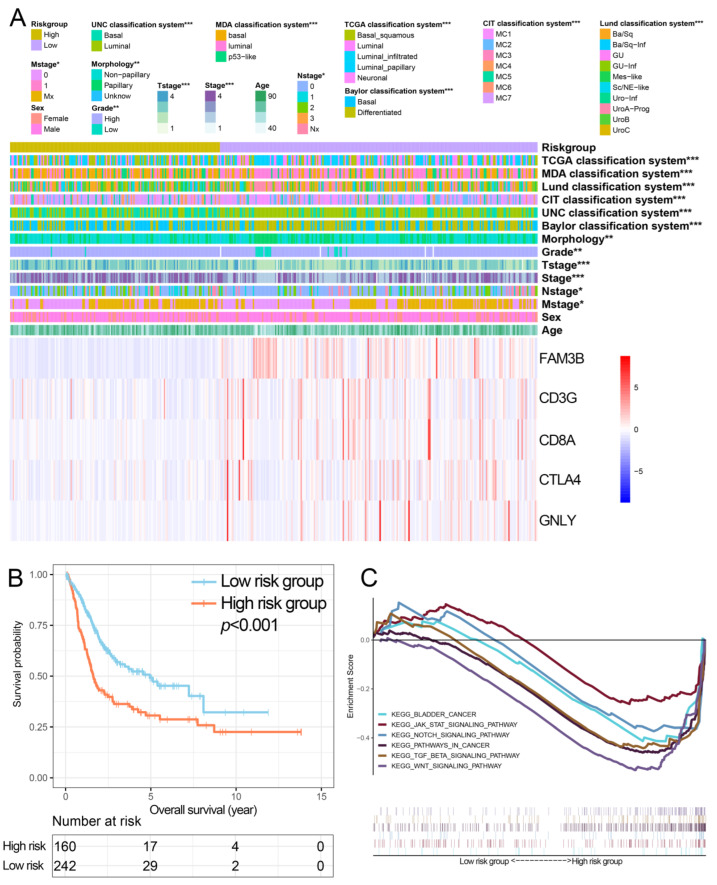
Figure 4.
Performance of the IPS in TCGA. (A) The distribution of molecular subtypes and clinicopathological features were compared between low- and high-risk groups. (B) Kaplan–Meier curves of overall survival for patients based on IPS. (C) Gene set enrichment analysis revealed significant oncogenic pathways associated with IPS. IPS, immune prognostic signature; TCGA, The Cancer Genome Atlas; KEGG, Kyoto Encyclopedia of Genes and Genomes. * p < 0.05, ** p < 0.01, *** p < 0.001.

