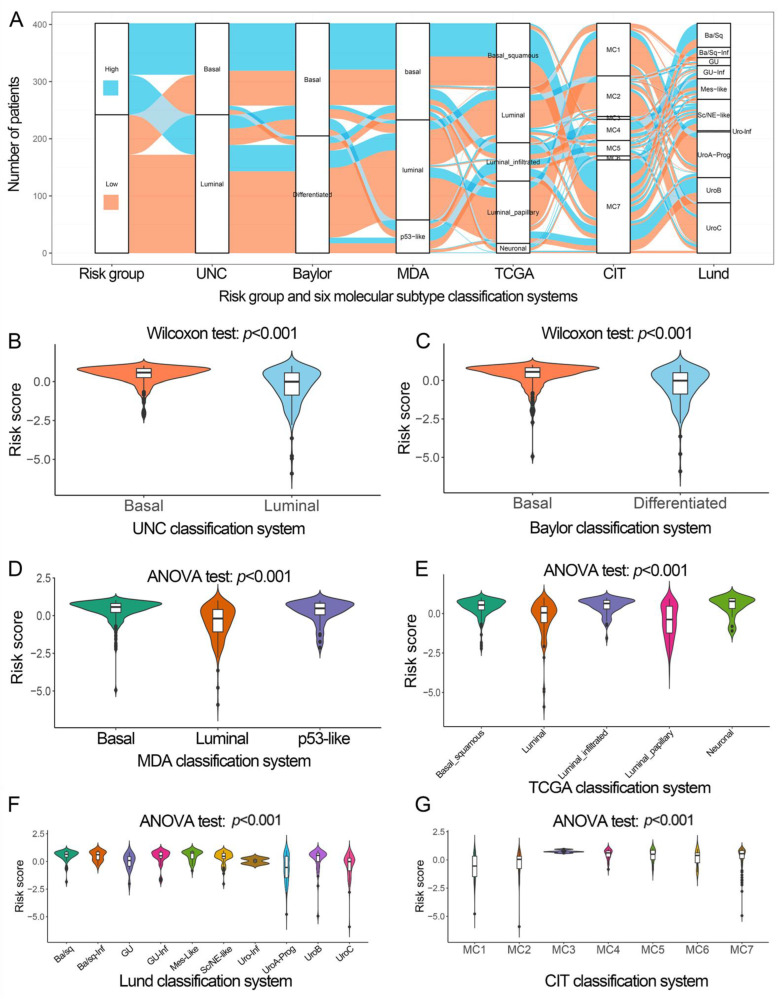
Figure 5.
The relationship between IPS and molecular subtypes of different classification systems in TCGA. (A) Alluvial diagram presents the changes in risk groups and indicates the molecular subtypes of different classification systems. (B–G) Differences in IPS between molecular subtypes in UNC, Baylor, IPS, MDA, TCGA, Lund, and CIT classification systems. IPS, immune prognostic signature; TCGA, The Cancer Genome Atlas.

