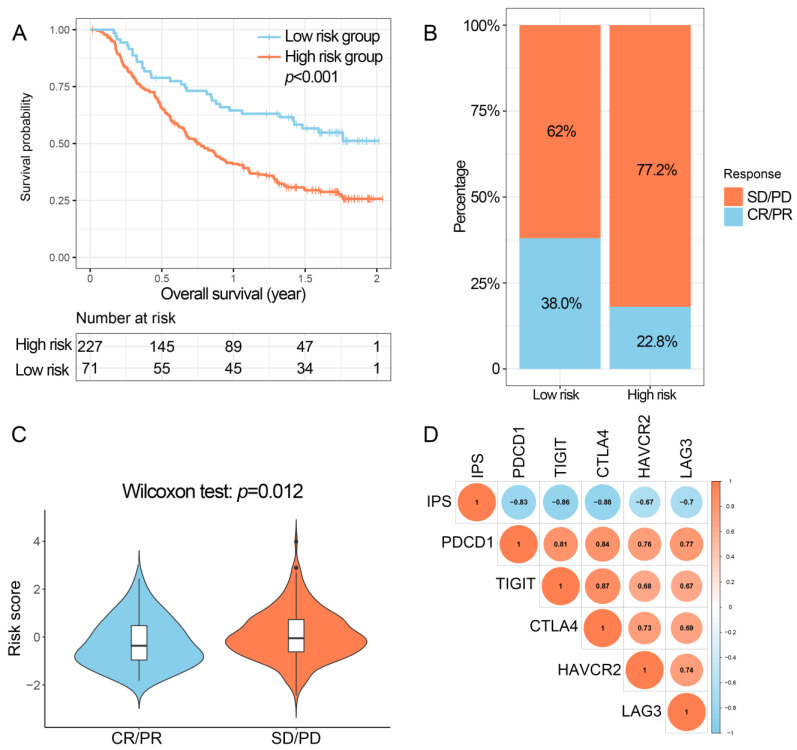
Figure 6.
Performance of the IPS in IMvigor210. (A) Kaplan–Meier curves of overall survival for patients based on IPS. (B) Differences in immunotherapy response between low- and high-risk groups. (C) Differences in IPS between CR/PR and SD/PD subgroups. (D) The correlation between IPS and expression of critical immune checkpoints. IPS, immune prognostic signature; CR, complete response; PR, partial response; SD, stable disease; PD, progressive disease.

