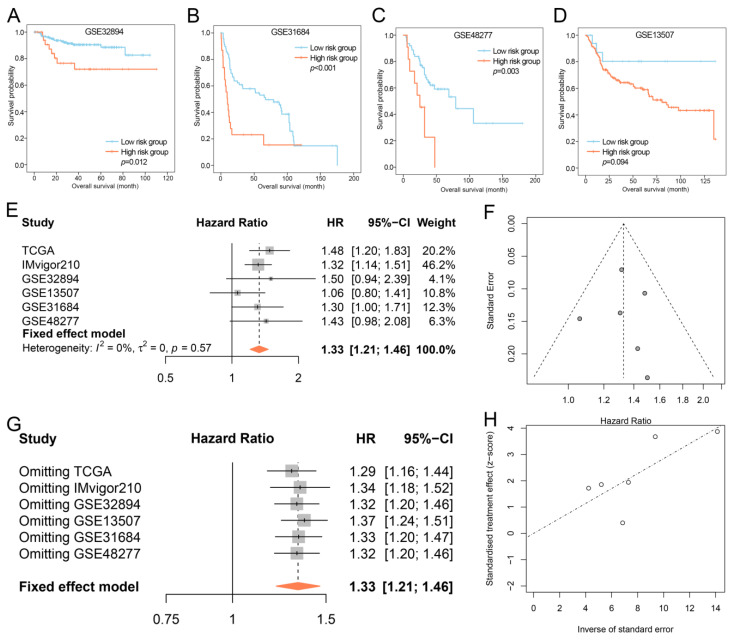
Figure 7.
Prognostic value of IPS in validation data sets. (A–D) Kaplan–Meier OS curves for patients assigned to high- and low-risk groups in the GSE32894 (A), GSE31684 (B), GSE48277 (C), and GSE13507 (D) data sets. (E) Forest plots of pooled HRs for investigating the impact of IPS on OS in each data set. (F) Funnel plots of meta-analysis. (G) Sensitivity analysis of meta-analysis. (H) Egger’s publication bias plot of meta-analysis. IPS, immune prognostic signature; OS, overall survival; HR, hazard ratio; CI, confidence interval.

