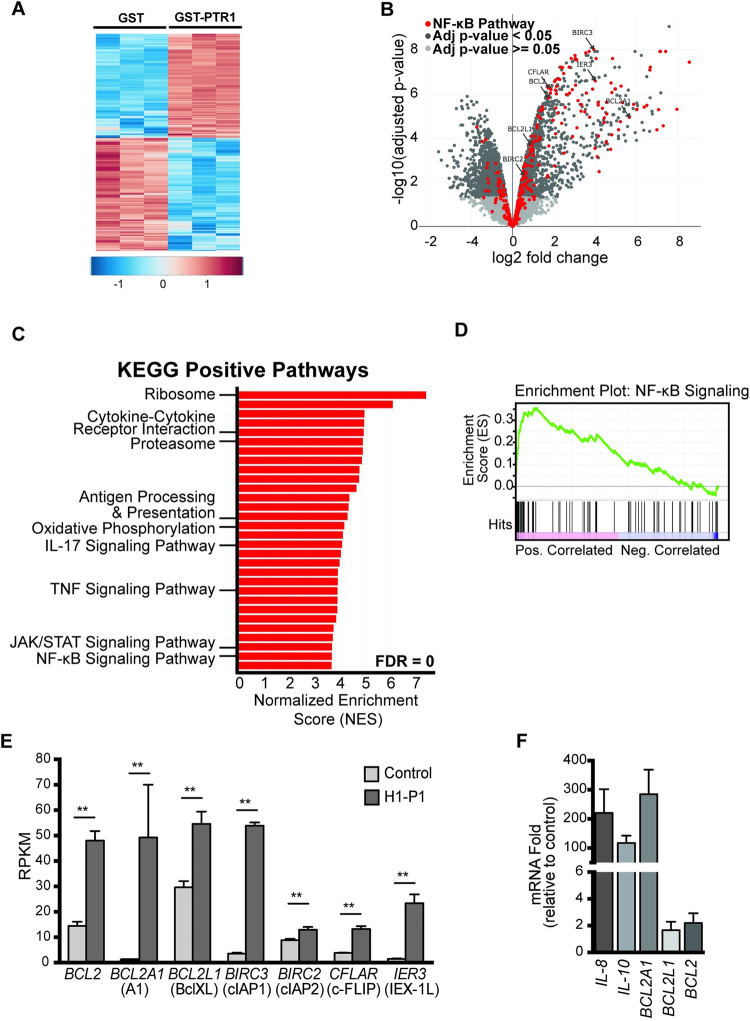
Fig 1. HAPLN1-PTR1 induces transcriptional changes, including an NF-κB transcriptional program.
(A) Heatmap summarized all the differentially expressed genes of two-fold. Each row is a gene, each column is a sample. (B) Volcano plot of RNA-Seq data illustrating significantly (dark gray) and non-significantly (light gray) changed genes in RPMI8226 cells treated with 100 nM GST-PTR1 for 6 hr, relative to control (100 nM GST). Genes depicted in red indicate known NF-κB regulated genes. The RNA-seq analysis was done in three biological replicates. (C) Gene set enrichment analysis (GSEA) for indicated KEGG pathways and the genes differentially regulated by HAPLN1-PTR1 versus control (GST). Shown are bars indicating normalized enrichment scores (NES) for top 30 positive pathways, all with an FDR = 0. The identities of some of the pathways are indicated. For more details, see S1 Table. (D) GSEA normalized enrichment score (NES) plots of the signature of the NF-κB pathway. (E) Reads per kilobase million (RPKM) values of select NF-κB target survival genes from the RNA-Seq results in A. (F) qRT-PCR analysis of select genes detected by RNA-Seq analysis in A. RNA levels of indicated genes in GST-PTR1-treated condition were normalized to GAPDH and fold change relative to control (100 nM GST) for each gene is plotted. Results represent the mean ± SD of three biological replicates. ** p<0.01.

