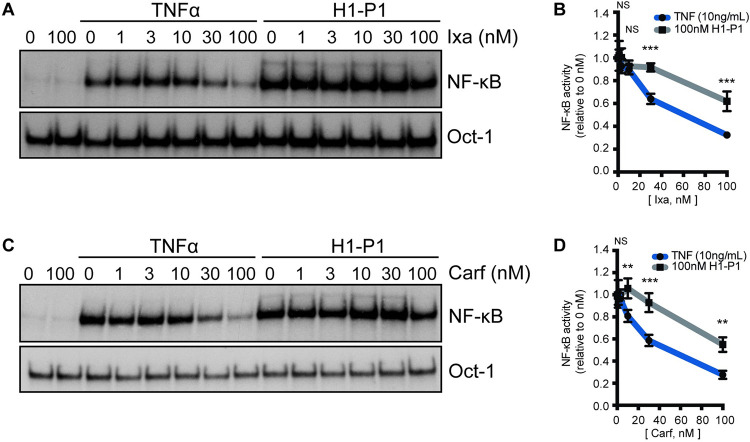
Fig 3. HAPLN1-PTR1-induced NF-κB activation is resistant to clinical PI’s.
(A) Representative EMSA analysis of RPMI8226 cells incubated with 10 ng/mL TNFα or 100 nM GST-PTR1 (H1-P1) in the absence or presence of increasing concentrations (nM) of ixazomib (Ixa). (B) Graph depicts the mean ± SD of the quantification of three independent replicates of EMSA analysis as in A. (C) Representative EMSA analysis as in A with increasing concentrations (nM) of carfilzomib (Carf). (D) Graph depicts the mean ± SD of the quantification of three independent replicates of EMSA analysis as in C. ** p<0.01, *** p<0.001.

