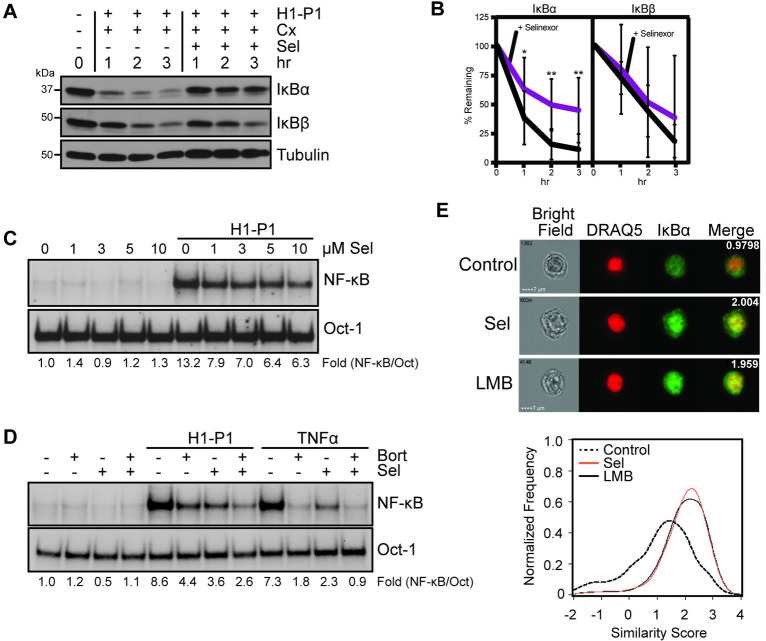
Fig 4. Selinexor inhibits HAPLN1-PTR1-induced IκBα degradation and NF-κB activation.
(A) Representative immunoblot analysis of IκBα, IκBβ and tubulin in RPMI8226 cells pretreated for 30 min with 20 μg/mL cycloheximide (Cx) with 10 μM selinexor (Sel) and stimulated with GST-PTR1 (H1-P1) for indicated times. (B) Graph depicts the mean ± SD of the quantification of three independent replicates of western blot analysis as in A. (C) EMSA analysis of RPMI8226 cells pretreated for 30 min with increasing concentrations of selinexor (Sel) and stimulated with GST-PTR1 (H1-P1). (D) EMSA analysis of RPMI8226 cells pretreated for 30 min with 10 μM Sel or 100 nM Bort and stimulated with 100 nM GST-PTR1 (H1-P1) or 10 ng/mL TNFα. (E) Upper: Images of RPMI8226 cells control and treated with 10 μM Selinexor (Sel) or 20 μg/mL Leptomycin B (LMB) for 45 min. The similarity score for each set of representative images is included in merged image. Lower: A representative similarity histogram for control and treated cells showing the co-localization of IκBα and the nuclear dye, DRAQ5.

