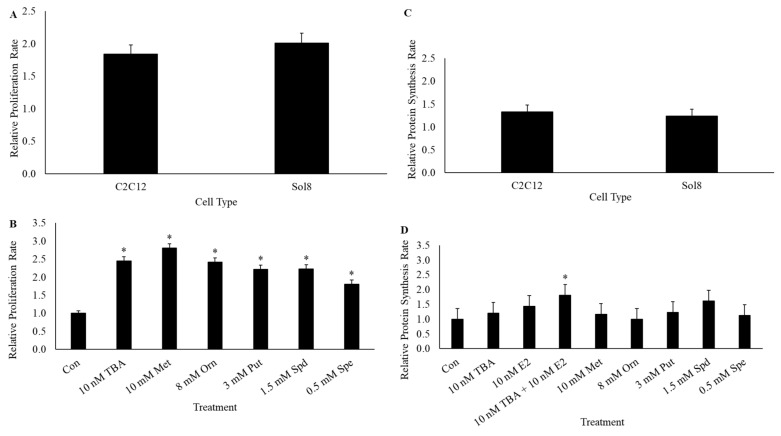
Figure 1.
Effect of cell type (C2C12 or Sol8 myoblasts) or treatment on proliferation rates (A,B) and protein synthesis rates (C,D). Proliferation assay treatments included 1% fetal bovine serum (FBS, control, Con), 10 nM trenbolone acetate (TBA), 10 mM methionine (Met), 8 mM ornithine (Orn), 3 mM putrescine (Put), 1.5 mM spermidine (Spd), or 0.5 mM spermine (Spe). Protein synthesis assay treatments included serum-free media (SFM, control, Con) as a control and the other treatments were similar to those described in the proliferation assay, with the exception of the addition of 10 nM TBA + 10 nM E2. Values shown in A and B represent the relative proliferation rate of each treatment compared to control cultures and are presented as the least square mean ± SEM from three separate replicates of C2C12 cultures and three separate replicates of Sol8 cultures. Values from (C,D) represent the relative protein synthesis rate of each treatment compared to control cultures and are presented as the least square mean ± SEM from five separate replicates of C2C12 cultures and five separate replicates of Sol8 cultures. Treatments with a star (*) indicate differences (p ≤ 0.05) between treatment and control cultures in (B,D).

