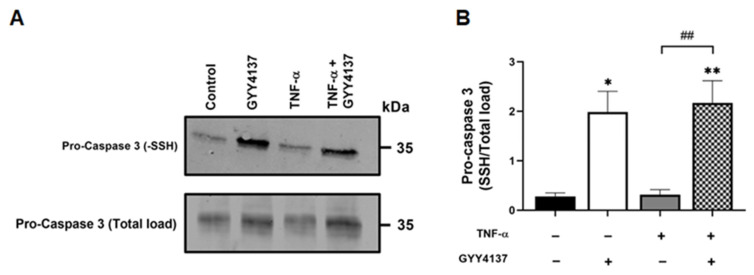
Figure 4.
GYY4137 post-treatment mediates sulfhydration of pro-caspase 3. (A) Representative immunoblots of S-sulfhydrated and total load pro-caspase 3 protein expression in HUVECs. (B) Bar graph of S-sulfhydrated pro-caspase 3 (-SSH/Total load) quantified by ImageJ. p-values were calculated using one-way ANOVA test followed by Tukey’s comparison test. Data are shown as means ± SD; * p < 0.05, ** p < 0.01 vs. control, ## p < 0.01 vs. TNF-α-treated groups only. N = 3 independent experiments with 3 replicate in each experiment.

