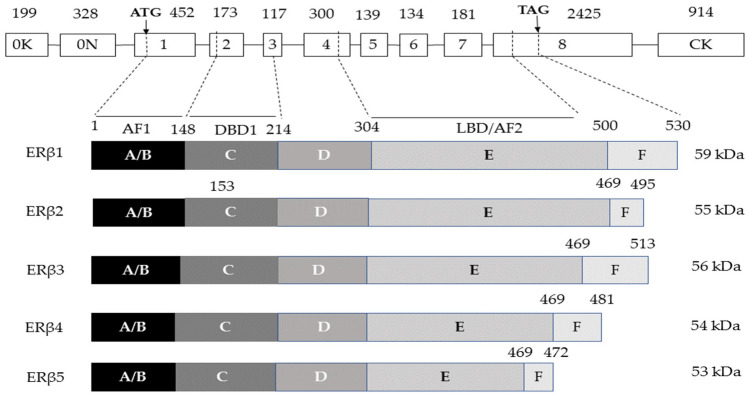
Figure 1.
ESR2 gene and its five protein isoforms are represented schematically. Exons 1–8 are depicted by boxes, exons 0K and 0N are two promoters at the gene’s 5′ end, and introns are represented by lines. Numbers above the boxes indicate the size (bp) of each exon, arrows point to the start (ATG) and stop (TAG) codons, and dotted lines connect the gene regions to the protein domains or isoforms that are encoded, from N-terminus to C-terminus, A/B: activation function 1 (AF1) domain, C: DNA-binding domain (DBD), D: hinge domain, E: ligand-binding domain (LBD) or activation function 2 (AF2) domain, F: C-terminal domain. The molecular weight of each isoform in kDa is shown by the numbers on the right side. The figure is adapted from [54].

