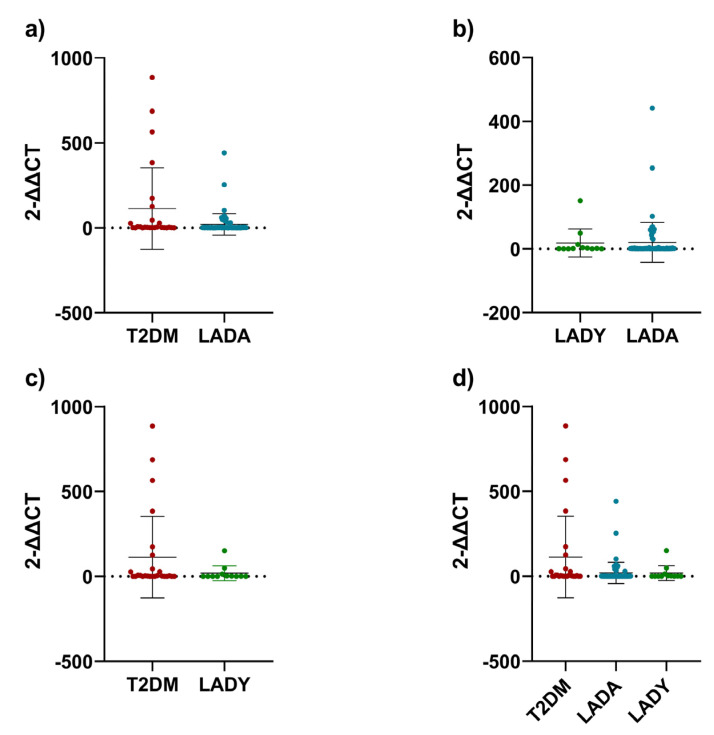
Figure 2.
Telomere lengths. (a) T2DM group compared to LADA group; (b) LADY group compared to LADA group; (c) T2D group compared to LADY group; (d) three groups compared together. For the analysis in graphic (a–c), Mann-Whitney test was used. For graphic (d), Kruskal-Wallis test was used. All data points were included after adjusting the telomere length to obtain arithmetic normalization of the samples obtained from the DNA extraction and rt-PCR analysis. Error bars represent the standard deviation.

