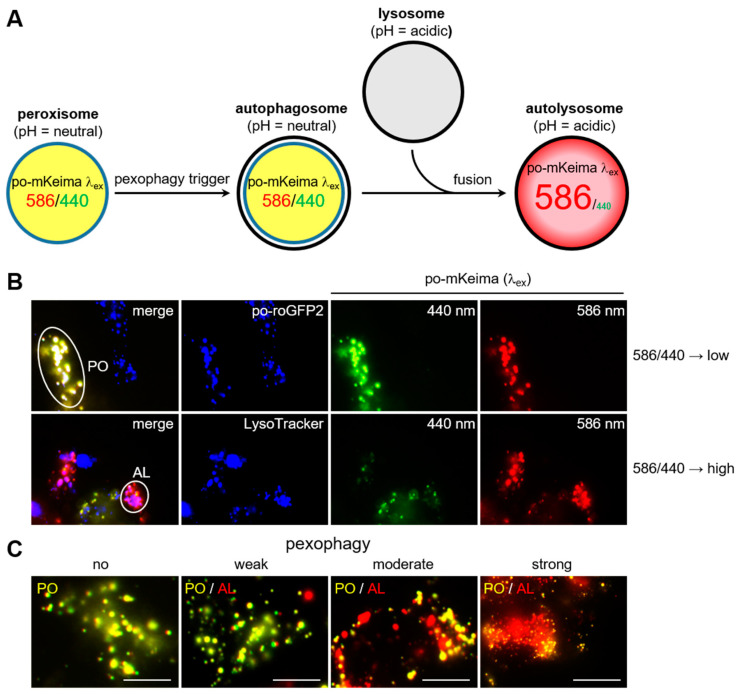
Figure 1.
Pexophagy detection in living cells using po-mKeima. (A) Schematic outline. (B) Colocalization analysis between the peroxisomal marker po-roGFP2 (false color: blue) or the acidotropic fluorescent probe LysoTracker (false color: blue) and po-mKeima excited at 440 nm (false color: green) or 586 nm (false color: red). The yellowish (=low 586/440 excitation peak ratio) and reddish (=high 586/440 excitation peak ratio) dots represent peroxisomes (PO) and autolysosomes (AL), respectively. (C) Examples of DD-DAO/po-mKeima Flp-In T-REx 293 cells displaying no, weak, moderate, or excessively high levels of pexophagy. Scale bar, 10 µm.

