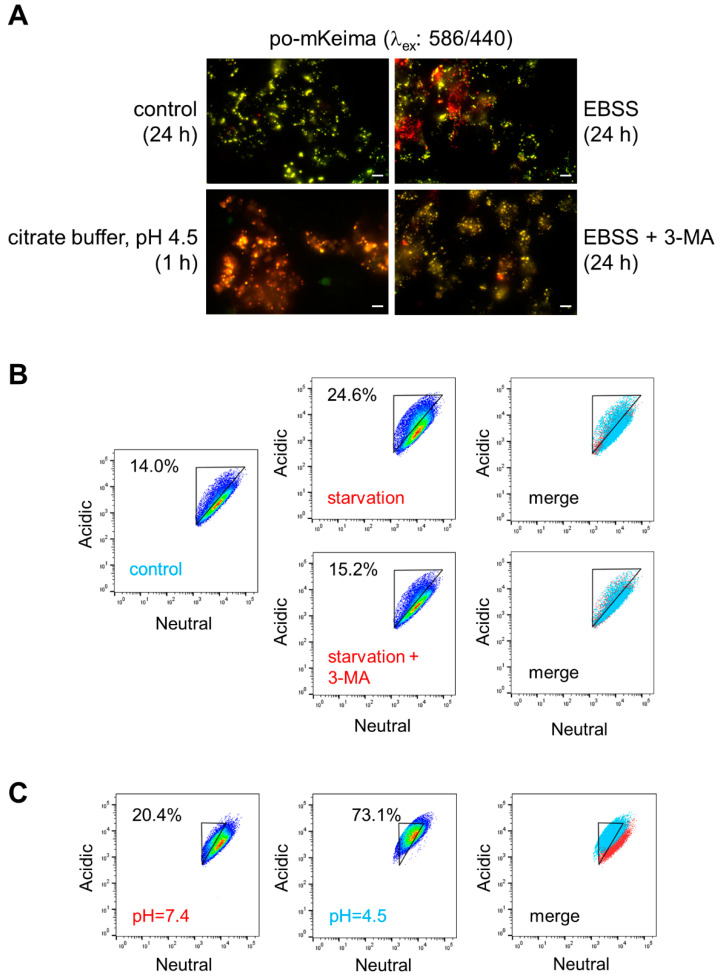
Figure 2.
In situ detection of starvation-induced pexophagy. DD-DAO Flp-In T-REx 293 cells stably expressing po-mKeima were precultured for two days in rMEMα. At time zero, the medium was replaced with pre-warmed rMEMα (control), Earle’s balanced salt solution (EBSS) supplemented or not with 5 mM 3-methyladenine (3-MA), or a citrate buffer (pH 4.5). After the indicated times, the cells were processed for fluorescence microscopy or FACS analysis. (A) Representative images of the po-mKeima staining patterns in each group. Images were captured as described in the Section 2. Scale bar, 10 µm. (B,C) Representative flow cytometry plots of each group. Note that a decrease or increase in the fluorescence intensities of the neutral and acidic channels can be used to gate and quantify the percentage of cells undergoing pexophagy (starvation) and acidification of the peroxisome lumen (citrate buffer, pH 4.5), respectively. The different colors represent the cell density at a given position.

