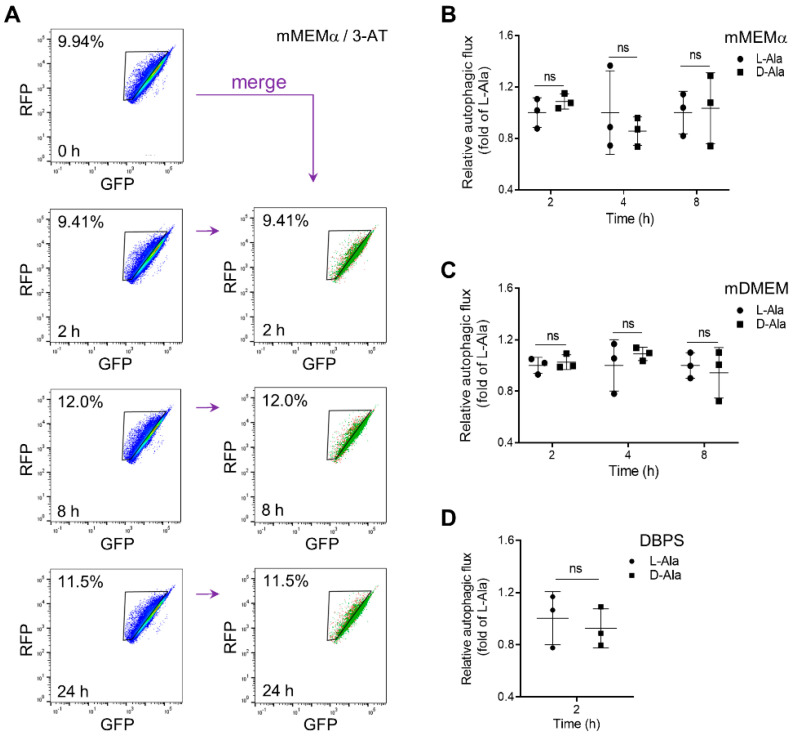
Figure 5.
Enhanced levels of po-H2O2 do not induce autophagy in mRFP-GFP-LC3B DD-DAO Flp-In T-REx 293 cells. DD-DAO Flp-In T-REx 293 cells stably expressing RFP-GFP-LC3 were cultured as described in the legend to Figure 3. Next, the cells were assayed in (A) mMEMα supplemented with 10 mM 3-amino-1,2,4-triazole (3-AT), (B) mMEMα supplemented with 10 mM L- or D-Ala, (C) mDMEM supplemented with 10 mM L- or D-Ala, or (D) DPBS containing 10 mM L- or D-Ala (for medium details, see Section 2). At the indicated time points, the cells were harvested and processed for FACS analysis. To measure the percentage of cells undergoing autophagy, the RFP-GFP-LC3 single-cell populations were gated for a decrease in GFP expression. The results are shown as flow cytometry plots (n = 1; the different colors represent the cell density at a given position.) or interleaved scatter plots (n = 3; data represent the means ± SD). The corresponding D- and L-Ala data were statistically compared (ns, non-significant).

