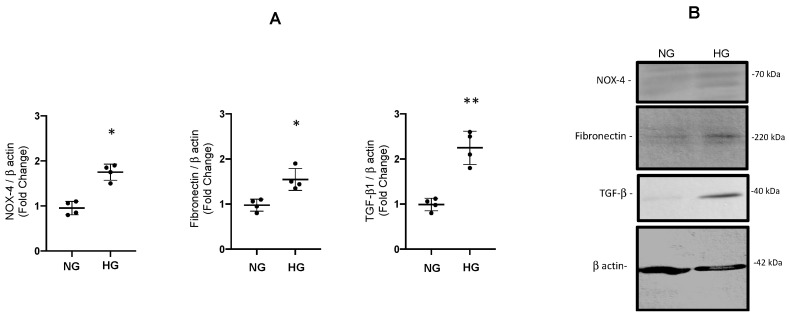
Figure 7.
(A). Protein abundances of fibronectin, TGF-β1 1 and NOX-4 after 48 h of high glucose conditions (HG) vs. normal glucose (NG) assessed by immunoblot in IMCD cells. * p < 0.05 vs. control group, ** p < 0.01 vs. control group n = 4. (B). Representative blot for each protein analyzed. The β-actin was used as loading control.

