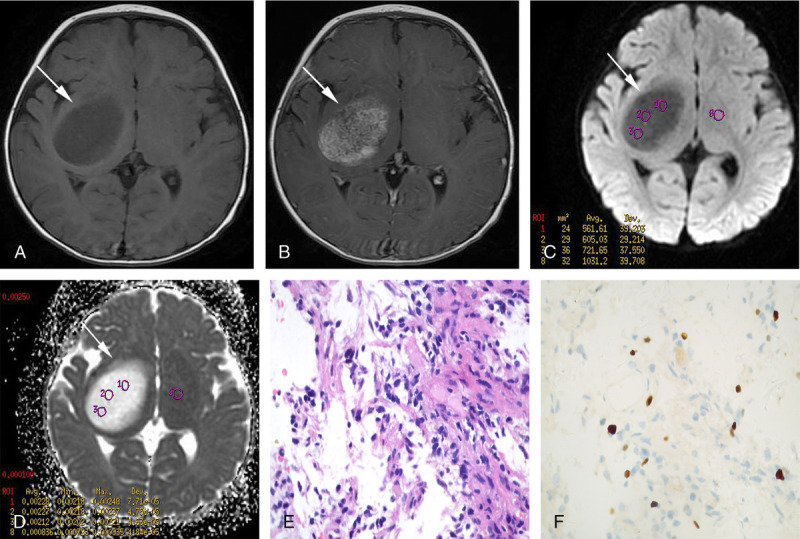
FIGURE 2.

A 1-year-old girl with pilocytic astrocytoma (World Health Organization grade 1) in the right basal ganglia region (white arrow). A, Axial T1 fluid-attenuated inversion recovery image reveals a low signal intensity. B, Axial contrast-enhanced T1-weighted image displays prominent enhancement. C, Axial diffusion-weighted image shows a low signal intensity. D, The axial apparent diffusion coefficient (ADC) map delineates high ADC values. E and F, Color graph showing results of pathological staining. E, Hematoxylin-eosin staining presents a biphasic architectural pattern with dense and loose areas, consisting of multipolar cells with round to spindled nuclei and Rosenthal fibers (×400 magnification). F, The Ki-67 proliferation index is low, with approximately 5% of tumor cells staining positive (×400 magnification). Figure 2 can be viewed online in color at www.jcat.org.
