Figure 1.
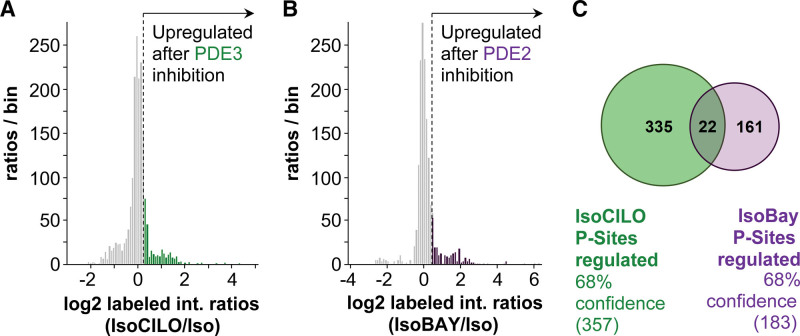
Analysis of the β-adrenergic phosphoproteome selectively elicited by inhibition of PDE3 (phosphodiesterase 3) or PDE2A. A, Frequency distributions of log2 intensity ratios to illustrate thresholding of PDE3-dependent and PDE2A-dependent (B) phosphoproteomics data for pathway analysis. The top 16% quantified phosphopeptides (highlighted in green and purple for PDE3A and PDE2A, respectively) were carried forward for further analysis. C, Venn diagram comparing the 16% upregulated phosphorylation sites in samples treated with the PDE3 inhibitor (green) or the PDE2A inhibitor (purple). The CI (68%) derives from the selected peptides lying outside 1 SD of the mean distribution of peptides, as shown in A and B, respectively. BAY indicates BAY 60-7550; Cilo, cilostamide; and Iso, isoproterenol.

