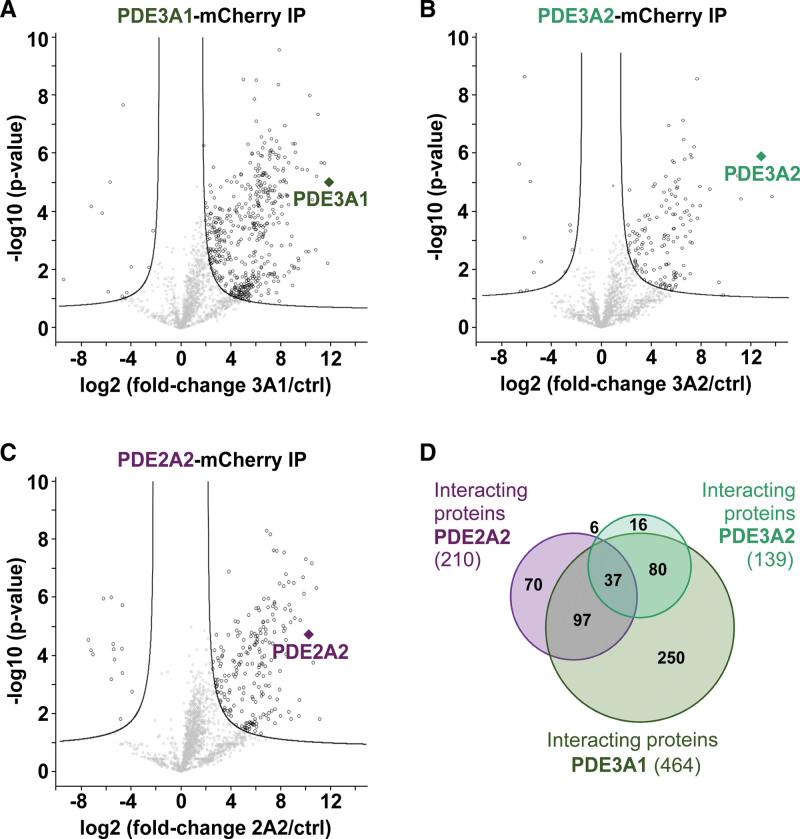
Figure 2.
Analysis of the PDE3A1 (phosphodiesterase 3A1), PDE3A2, and PDE2A2 interactomes. A, Volcano plot of the PDE3A1-mCherry interactome (false discovery rate [FDR], 0.03; S-zero is the fold-change threshold [S0], 1.3). B, PDE3A2-mCherry interactome (FDR, 0.05; S0, 0.8). C, PDE2A2-mCherry interactome (FDR, 0.03; S0, 1.3). D, Area-proportional Venn diagram to compare significant interactors in PDE3A1, PDE3A2, and PDE2A2 affinity purifications.

