Figure 6.
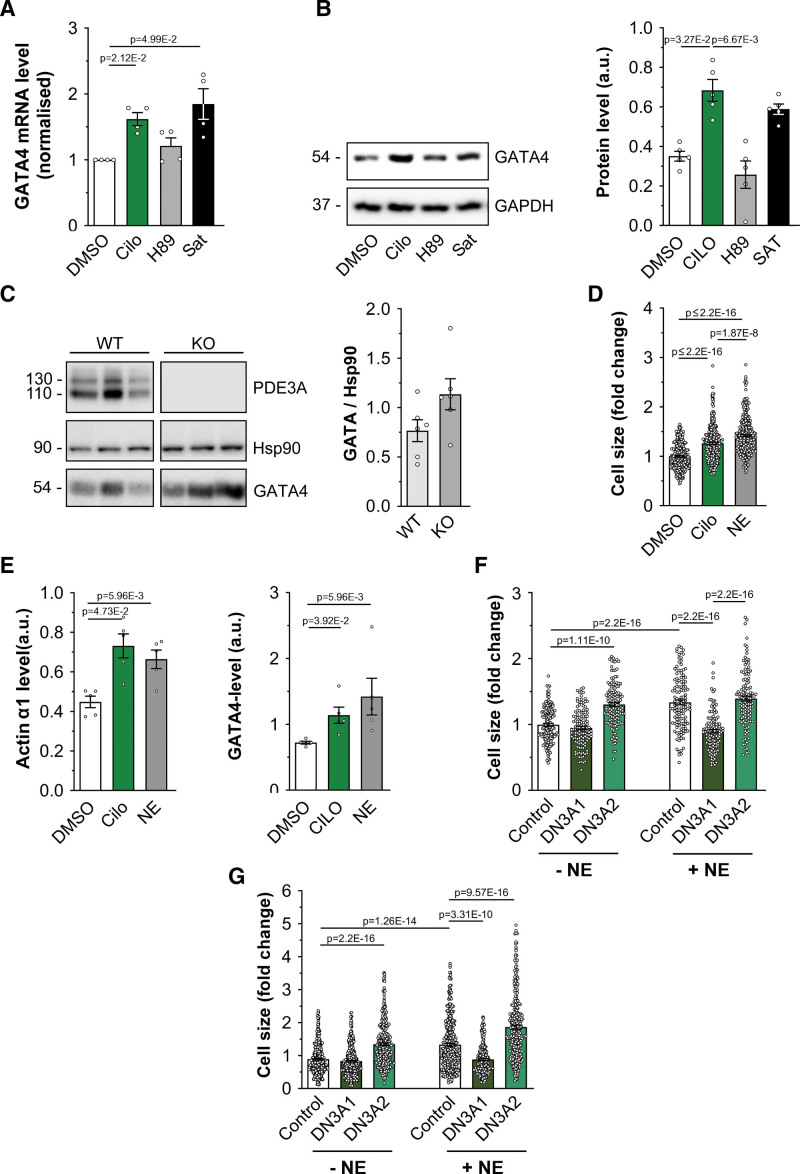
Inhibition of PDE3A (phosphodiesterase 3A) regulates GATA4 (GATA4 binding protein 4) expression. A, Quantitative real-time polymerase chain reaction analysis of GATA4 mRNA transcripts in neonatal rat ventricular myocyte (NRVM) cells treated with 10 μM cilostamide (Cilo), saturating treatment (Sat, 100 μmol/L 3-isobutyl-1-methylxanthine [IBMX] and 25 μmol/L forskolin) or 30 μmol/L H89 for 2.5 hours. Bars show GATA4 mRNA values normalized to GAPDH and dimethyl sulfoxide (DMSO) treatment and are presented as mean±SEM. n=4 biological replicates. Kruskal-Wallis test with Dunn correction for multiple comparisons. B, Western blot analysis and quantification of GATA4 protein expression in NRVM cells treated with Cilo (10 μmol/L), H89 (30 μmol/L), or saturating treatment. GAPDH served as a loading control. Values are normalized to GAPDH and are presented as mean±SEM. n=5 biological replicates. Kruskal-Wallis test with Dunn correction for multiple comparisons. C, Western blot analysis and quantification of endogenous GATA4 expression in cardiac tissue lysates obtained from PDE3A knockout or wild-type control rats. Hsp90 served as a loading control and for normalization in the quantification. Values are mean±SEM. n=6 biological replicates. Mann-Whitney U test. D, Cell size measured in adult rat ventricular myocytes (ARVMs) either untreated or treated with Cilo (10 mmol/L) or NE (10 μmol/L) for 24 hours. Values are normalized to DMSO control and expressed as mean±SEM. n=5 independent experiments (at least 241 cells per condition). Normality of log-transformed data was tested with Anderson-Darling test. P values were determined by a hierarchical significance test using log-transformed data followed by Bonferroni correction. E, Quantification by Western blot analysis of hypertrophy markers protein expression level in samples as shown in D. n=5 independent experiments. Kruskal-Wallis test with Dunn's correction. F, Cell size measured in ARVM expressing mCherry (control) or the catalytically inactive mutant PDE3A1-DN-RFP or PDE3A2-DN-RFP (left) and treated as indicated for 24 hours. n=5 independent experiments (at least 53 cells per condition). Normality was established by the Anderson-Darling test. Hierarchical significance analysis with final Bonferroni correction for multiple comparisons. G, Cell size measured in human induced pluripotent stem cell-derived cardiomyocytes (hiPSC-CM) expressing mCherry (control) or the catalytically inactive mutant PDE3A1-DN-RFP or PDE3A2-DN-RFP (left) and treated as indicated for 48 hours. n=6 independent experiments (6 different differentiations of 3 independent hiPSC lines, at least 231 cells per condition). P values were determined by hierarchical significance test using log-transformed data followed by Bonferroni correction.

