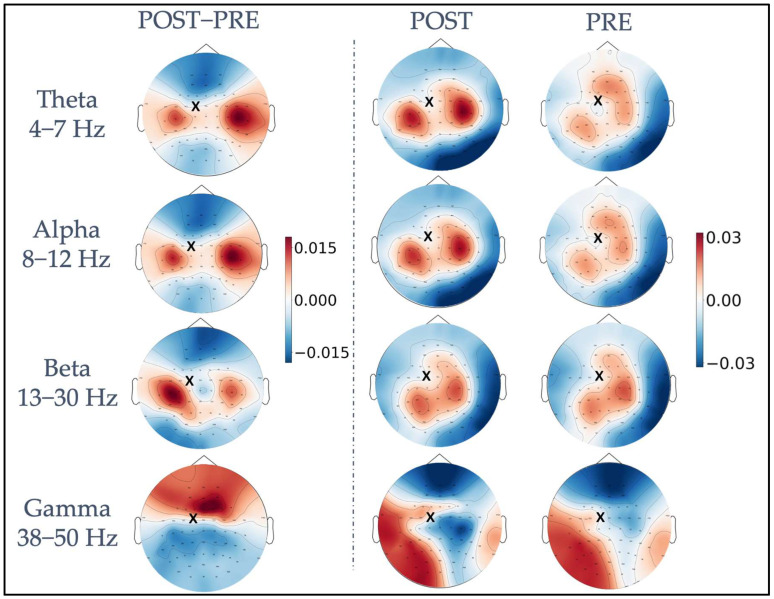
Figure 2.
Representation of TMS-induced functional connectivity modulation in the theta, alpha, beta, and gamma frequency bands. The first column shows the difference in iPLV between post-stimulus and pre-stimulus conditions, calculated between the FC1 stimulation site (indicated with a black x) and the whole brain. In the second and third columns, post-stimulus iPLV and pre-stimulus iPLV are represented, respectively.

